

The age of Australian uranium
A case study of the Koongarra uranium deposit
Summary
The objective of this study is to examine the published U/Pb dating results obtained from mineral samples from the Koongarra uranium deposit, Northern Territory. The results have been obtained on the basis of the assumption that the U/Pb system must have always been closed. The evidence presented serves to demonstrate conclusively that the U/Pb system in this uranium deposit has been so open that it is impossible to be sure of the precise history of U and Pb in any sample selected for dating, making any age determinations meaningless. The Th/Pb age of the deposit, indicated by the published results, is zero years, a contrasting and significant result.The Koongarra uranium deposit
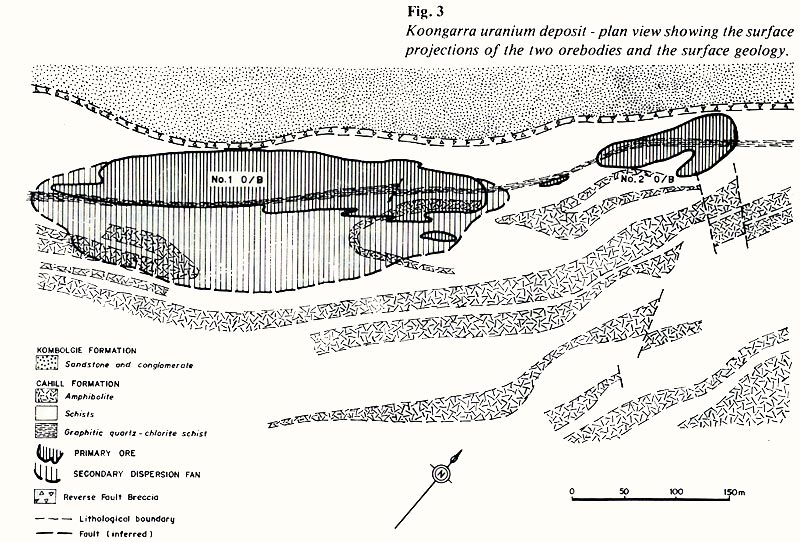
Located 225 km (140 miles) east of Darwin in the Northern Territory (Fig. 1), the Koongarra uranium deposit is one of four large high grade deposits now being developed in the area, known as the Alligator Rivers Province. The deposit lies beneath a gently sloping erosion surface just below the sandstone cliffs of the Mount Brockman Mesa, an outlier from a regionally extensive sandstone plateau (Fig. 2). This thick, flat-lying sandstone unconformably overlies the ore-hosting schists, and in the recent past served as a cover rock for the Koongarra orebodies.
 |
The uranium mineralisation occurs in two distinct orebodies separated by a barren gap (Fig. 3). Both orebodies consist of primary zones of partially coalescing lenses containing pitchblende veins, essentially stratabound within the steeply dipping host Lower Proterozoic schists (Fig. 2). With the erosion of the sandstone cover, the top of the No. 1 orebody has been exposed to surficial weathering processes, resulting in dispersion of uranium downslope in the weathered rock to form a fan of secondary mineralisation (see Fig. 2).
Minor galena (PbS), (FeS2), and chalcopyrite (CuFeS2) are associated with pitchblende in the primary zones, along with rare native gold and other sulphides.
U/Pb dating of the Koongarra deposit
 Figure 2. View larger image. |
 Figure 3. View larger image. |
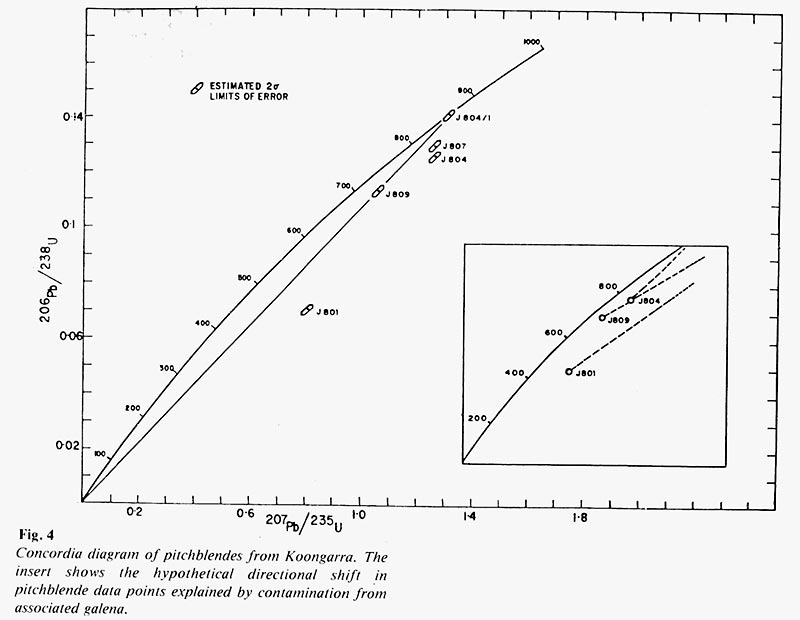
The uranium ore at Koongarra has been dated by the U/Pb method (1,2). (See Appendix 3). Both pitchblendes and galenas were handpicked from drill core and isotopically analysed. Table 1 lists the analytical results and the dates calculated from them, while Fig. 4 shows the data plotted on the conventional Concordia diagram (the ‘concordia’ is the curve along which the 206Pb age equals the 207Pb age). Note that in Table 1 the ages as calculated actually range from 447 million A.G.Yr. (A.G.Yr = arbitrary geologic years) to 1282 million A.G.Yr., and that the 206Pb age < 207Pb age < 207Pb–206Pb age, just as would be predicted on the basis of neutron reaction (3). But the age of the pitchblende was concluded to be 870 million A.G.Yr. due to one ‘concordant’ point on the concordia diagram (Fig. 4) amidst a wild scatter of the other four data points.
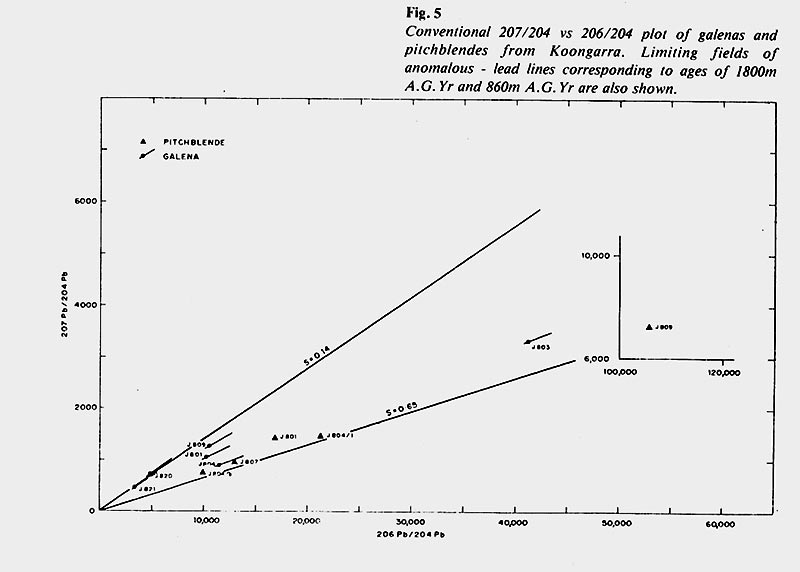
In order to account for the wild scatter of the data, the Pb isotopic ratios of the pitchblendes and associated galenas were plotted on the conventional 207/204 vs 206/204 diagram (Fig. 5). The Pb ratios all plot on or between the two radiating lines which represent the limiting fields of the data on the diagram. These lines are supposed to correspond to ages of approximately 1800 million A.G.Yr (upper line), defined by galenas only, and 860 million A.G.Yr (lower line), defined by pitchblendes only. Thus it was concluded by Hills & Richards (1,2) that the galenas associated with the pitchblendes suggested an older 1800 million A.G.Yr source for their Pb isotopes. Consequently what I term ‘arbitrary’ line fitting through the wild scatter of pitchblende data points on the concordia diagram (Fig. 4 insert) ‘confirmed’ the desired conclusion that these pitchblendes are contaminated with the Pb produced by an 1800 million A.G.Yr old generation of pitchblendes which has long since been destroyed.
A critical comment and revision
The conclusion that the 870 million A.G.Yr old pitchblendes in the samples studied, are contaminated with Pb from a previous generation of now destroyed pitchblendes, is really another way of saying that both U and Pb have migrated with time in the deposit.
The geochronologists have in reality suggested that the present pitchblendes formed 870 million A.G.Yr ago from migrating U released by the destruction of previous pitchblendes which did not leave a trace, apart from the minor Pb contamination of the present pitchblendes, and effectively resetting the U/Pb isotopic ‘clock’. This is of course a statement that this U/Pb, system was open. A situation which is contrary to the first basic assumption of radioactive dating that the system must be closed. In spite of data manipulation to explain away discrepancies, there is no way that any geochronologists could be sure that all the Pb in the pitchblendes is not derived from contamination thus producing an erroneous large age.
There are 4 main lines of evidence that the system at Koongarra has been open (4,5,6,7) and the implications of these are that the attempts to date Koongarra using U/Pb isotopes are invalid.
 Figure 4. View larger image. |
 Figure 5. View larger image. | ||

(a) Ore textures
 Figure 7. View larger image. |
 Figure 8. View larger image. |
Mineralogical and textural studies of the ore under both optical and electron microscopes indicate that there have been at least three remobilisations of the uranium during the history of the ore. Lead has likewise been mobile. This is shown diagrammatically in Fig. 6 as several generations of pitchblende and galena. Plates 1–6 illustrate examples of the ore textures as seen under the microscopes, the descriptions accompanying the plates indicate how the textures have been interpreted.
(b) Mineral chemistry
Pitchblende compositions are never uniform. Electron microprobe analyses of pitchblendes, that is, micro-analyses of volumes of pitchblende between 5 and 10 cubic microns (Table 2), reveal that pitchblende compositions, particularly U, Pb and Ca contents, change not only from grain to grain within any one sample regardless of which generation of pitchblende it is, but even at the microscopic level within pitchblende grains themselves. Fig. 8 illustrates how Pb and Ca are both substituting for U in the UO2 cubic lattice.
(c) Supergene alteration
Supergene alteration (oxidation) of pitchblendes has not only occurred where the zone of surficial weathering has intersected the top of the No. 1 orebody, but at depth within the primary ore. Pitchblendes have been replaced by a wide variety of colourful secondary uranium minerals (Table 3), their identities depending on the chemistries of the immediate environment and the circulating groundwaters (Fig. 2 and 8). The nett result has been dispersion of uranium over distances of up to 50 metres or more in the weathered zone with complete destruction of pitchblendes, and yet another remobilisation of both U and Pb in the primary ore zones with in situ replacement of pitchblendes (Plates 7-9) and deposition of supergene pitchblendes and uranyl silicates from U in solution (Plates 10-12). The analyses in Table 4 show how the U and Pb contents decrease as pitchblende is altered to uranyl silicates, which absorbed the migrating U and Pb.
 Plate 1 Remobilisation and redeposition of pitchblende (white mineral). Photomicrograph shows pitchblende veins (top and bottom) partially destroyed by dissolution of uranium which has been redeposited as scattered veinlets and shapeless masses of a new generation of pitchblende (middle). (magnification 10X) |  Plate 2 Pitchblende (light grey) has been dissolved and redeposited as thin veinlets and shapeless masses within a chlorite (dark grey) matrix which is also replacing the main pitchblende grain. (magnification 120X) |
 Plate 3 Two generations of pitchblende—grains (lighter grey), and more oxidised supergene veins and patches (darker grey). The small scattered white grains are galens. (magnification 200X) |  Plate 4 Two generations of pitchblende—grains (white, top of photomicrograph) and later think supergene encrustations (mid grey) around quartz grains (dark grey). The very bright mineral (bottom) is galena which has similarly been dissolved and redeposited. (magnification 200X) |
 Plate 5 Remobilised pitchblende (light grey) deposited as scattered grains with a chlorite (dark grey) matrix. A remobilised galena vein (white-grey) cuts across the pitchblende-chlorite association. (magnification 50X) |  Plate 6 An enlarged view of pitchblende (dark grey) sub-grains veinlets which both cross-cut and separate the pitchblende sub-grains. The PB in the galena is supposed to have migrated from the pitchblende where it was supposedly produced by radioactive decay. (magnification 50X) |
 Plate 7 Kasolite (white) and uranophane (grey) replacing a former pitchblende vein. Note that the former vein shape, even the sub-grains, have essentially been preserved. (magnification 210X; scale bar 50 microns) | 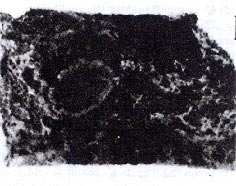 Plate 8 Globular pitchblende mass (black shape just to the left of centre) being altered marginally to sklodowskite (grey concentric sheath). (magnification 2X; scale bar 3mm) |
 Plate 9. Kasolite (light grey) and sklodowskite (dark grey) replacing a former pitchblende vein. (magnification 210X) |  Plate 10. Supergene colloform banded pitchblende (grey) deposited in what was originally a void. The banding is produced by a time sequence of pitchblende deposition. (magnification 840X) |
 Plate 11. A sklodowskite (white) vein composed of radiating aggregates of needle-shaped crystals. (magnification 220X; scale bar 50 microns) |  Plate 12. Uranophane (white) veinlets deposited between quartz (grey) grain boundaries. (magnification 220X; scale bar 50 microns) |
(d) Uranium/daughter disequilibrium
There are two methods of measuring the grade of a uranium ore sample:
- by assaying for U directly using standard chemical or related techniques; and
- by measuring the radioactivity given off by the ore sample, the quantity of such radioactivity being related to the U content.
However, because the radioactivity measured is actually the gamma radiation given off by the daughter element bismuth-214 (214Bi) far down the 238U decay chain, any addition or removal of daughter elements between 238U and 214Bi will result in a discrepancy between the above two measurements of the U content of the ore sample. To assess this possibility the two measurements are compared:
Three possibilities arise:
(i) Ratio = 1. The ore sample is said to be in equilibrium since the two measurements agree, implying that the U and its daughter elements are in equilibrium; neither have apparently migrated.
(ii) Ratio > 1. The ore sample is said to be in disequilibrium and since the U content is greater than the daughter element content either U has been added to the sample or daughter elements removed.
(iii) Ratio < 1. Again the ore is said to be in disequilibrium but now the U content is less than the daughter element content implying either U removal or daughter element addition to the sample.
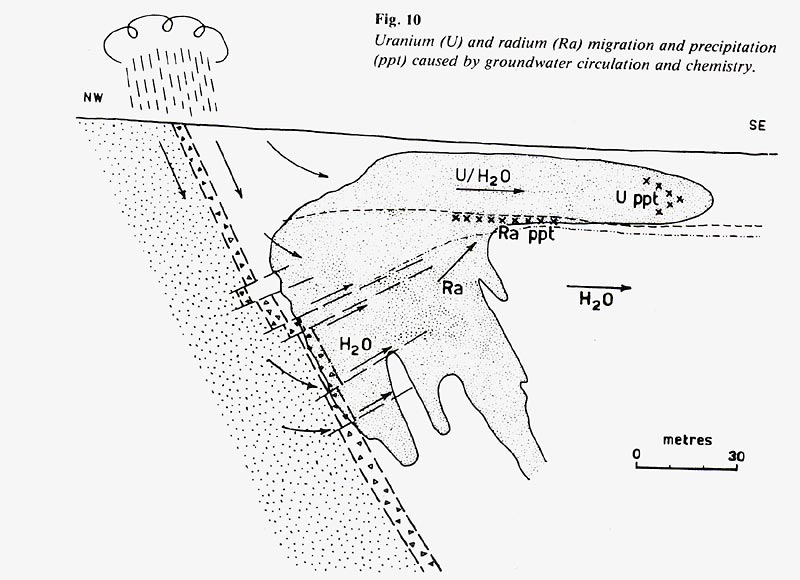
Measurements on ore samples from Koongarra indicate that the ore is in overall disequilibrium (Fig. 10 and Table 6). High resolution gamma-ray spectroscopy was then used to determine which daughter elements of 238U have been mobilised. These investigations showed that even though the high grade pitchblende ore is near equilibrium, radium-226 (226Ra) and radon-222 (222Rn) (a gas) have migrated from the ore into the surrounding host rocks, the ore being generally depleted in 226Ra and 222Rn, and the immediate host rocks being relatively enriched in these two elements (Table 6). Fig. 10 schematically illustrates the movements of isotopes caused by present day circulating groundwaters. This demonstrated migration of 226Ra from the pitchblende ore is significant in that it removes the lower two-thirds of the 238U decay chain from the pitchblende, thus resulting in 206Pb relocation and spurious 206Pb ages (8).
 Figure 9. View larger image. |
 Figure 10. View larger image. |
(e) Conclusions
The above evidence conclusively demonstrates that the U/Pb system, including its intermediate daughter products, especially Ra and Rn, has been so open with repeated large scale migrations of the elements that it is impossible to be sure of the precise status/history of any piece of pitchblende selected for dating. Even though geochronologists take every conceivable precaution when selecting pitchblende grains for dating, in the light of the above evidence, no one could be sure that the U and Pb they are measuring is ‘original’ and unaffected by the gross element movements observed and measured. Those pitchblende grains dated have always contained Pb, both within their crystal lattices and as microscopic inclusions of galena, making it impossible to be sure that all the Pb was generated by radioactive decay from U. In addition, the pitchblende grains don’t have uniform compositions so that ‘dating’ of sub-sections of any grain would tend to yield widely divergent U/Pb ratios and therefore varying ‘ages’ within that single grain. A logical extension of these data & conclusions is to suggest as others already have (9,10). that U/Pb ratios may have nothing to do with the age of a mineral. So that in spite of the ‘popular’ dating results looking sensible, the evidence clearly indicates that these dates are meaningless.
References
- Hills, J.H., Ph.D. thesis (unpubl.), Macquarie Univ., 1973.
- Hills, J.H. & Richards, J.R., Mineral, Deposita 11(133), 1976.
- Slusher. H.S., I.C.R. Tech. Mon. No. 2, 1973.
- Snelling, A.A. & Dickson, B.L., Mineral. Deposita 14, 109, 1979.
- Snelling, A.A., in Uranium in the Pine Creek Geosyncline, Internat. Atomic Energy Agency, Vienna 487, 1980.
- Dickson, B.L. & Snelling, A.A., in Uranium in the Pine Creek Geosyncline, Internat. Atomic Energy Agency, Vienna 499, 1980.
- Snelling, A.A., Ph.D. thesis (unpubl.). Univ. of Sydney, 1980.
- Gulson, B.L. & Mizon, K.J., in Uranium in the Pine Creek Geosyncline, Internat. Atomic Energy Agency, Vienna 439, 1980.
- Gentry, R.V., Christie, W.H., Smith, D.H., Emery, J.F., Reynolds, S.A., Walker, R., Cristy, S.S. & Gentry, P.A., Science194(315), 1976.
- Kazmann, R.G., Geotimes, 18 September 1978
- Stieff, L.R., Stern, T.W., Oshiro, S. & Senftle, F.E., U.S. Geol. Survey Prof., Paper 334-A, 1959.
| Table 5 – Analyses of iron and manganese oxides. | ||||||
|---|---|---|---|---|---|---|
| CAS 165 | CAS 114/1 | CAS 114/2 | CAS 95/1 | CAS 95/2 | CAS 95/3 | |
| UO2 | 2.81 | 1.63 | 1.05 | 0.36 | 2.83 | 1.91 |
| PbO | 12.42 | 4.41 | 0.30 | 5.03 | 8.16 | 3.34 |
| CaO | 0.20 | 0.09 | 1.d. | 0.04 | 0.15 | 0.12 |
| SiO2 | 2.49 | 3.11 | 6.28 | 2.87 | 2.54 | 3.20 |
| ∑Fe(FeO) | 5.50 | 8.71 | 81.46 | 0.47 | 11.09 | 58.16 |
| MnO2 | 77.48 | 80.35 | 1.96 | 88.52 | 73.53 | 27.70 |
| MgO | 0.12 | 0.37 | 2.09 | 0.29 | 0.52 | 0.22 |
| Al2O3 | 0.15 | 1.23 | 2.70 | 0.82 | 1.75 | |
| P2O5 | 0.33 | 1.d. | 1.d. | 1.d. | ||
| V2O3 | 1.d. | 0.31 | 0.65 | 0.26 | ||
| Total | 101.50 | 99.90 | 93.14 | 100.59 | 100.29 | 96.66 |
Appendix 1
A zero age for the Koongarra uranium deposit
In their U/Pb dating of the Koongarra uranium deposit (1, 2). the geochronologists overlooked one critical aspect—the 232Th/208Pb relationship. In Table 1, taken directly from the published results (1), the %Th, 208Pb proportion, and 208Pb/207Pb and 208Pb/204Pb ratios are given, but the 208Pb ages are conspicuously absent. Their omission is significant.
The 204Pb content of the pitchblende is regarded as ‘common’ or original Pb since it is not derived from any parent element via radioactive decay. Because this so-called ‘common’ Pb correction has to be applied to the raw data before calculation of the U/Th/Pb ages. This, of course, is again another way of saying that not all the Pb is derived by radioactive decay, but that it was with the U and Th ‘in the beginning’. The standard used to correct the data in Table 1 was the Mt Isa Pb* standard with an isotopic composition:
| 1.44% 204Pb | 23.20% 206Pb | 22.48% 207Pb |
| 52.88% 208Pb | ||
When this ‘common’ Pb correction is applied to the data in Table 1 (11). most of the 208Pb has resulted from ‘common’ Pb contamination. In fact, in samples J804/1, J804/b and J807 all the 208Pb is due to contamination and none resulted from 232Th decay, thus resulting in 208Pb ages of 0 yrs for these samples. The remaining two samples yield 208Pb ages (11) of 275 million A.G.Yr (J801) and 61 million A.G.Yr (J809), both considerably less than all the other Pb ages. Since the 232Th/208Pb age is taken as the standard isotopic Pb clock (3), the consensus radiometric age of the Koongarra uranium deposit is 0 yrs, since this is the only isotopic Pb date supported directly by a majority of samples. One suspects that the 207Pb ages were left out of the published data because of the uncomfortable implications!
*It should be noted in passing also that the choice of the Mt Isa Pb standard is based on one of several possible theories of element nucleogenesis and Pb evolution (1,2,3), making the whole age calculation procedure rather subjective, since it is based on additional assumptions.
Appendix 2
All radiometric dating methods are based on three assumptions:
- The physico-chemical system must have always been closed. Thus nothing inside the system could have been removed, and nothing outside the system added to it.
- The system must initially have contained none of its daughter elements.
- The decay rate or half-life of the radioactive parent element must have always been the same, that is, constant.
Appendix 3
The U/Pb method is the most important of all the radiometric dating techniques, not only because it was first historically, but because other methods are calibrated against it. U/Pb dating actually involves the measurement of several long parent-daughter decay chains, namely:
- uranium-238 (238U) decays to produce lead-206 (206Pb) with a half-life of 4.5 billion A.G.Yr.
- uraniun-235 (235U) decays to produce lead-207 (207Pb) with a half-life of 0.7 billion A.G.Yr.
- thorium-232 (232Th) decays to produce lead-208 (208Pb) with a half-life of 14.1 billion A.G.Yr.
Readers’ comments
Comments are automatically closed 14 days after publication.