

Journal of Creation 19(1):88–96, April 2005
Browse our latest digital issue Subscribe
Did a jaw muscle protein mutation lead to increased cranial capacity in man?
A recent study identified a possible deactivating mutation in the gene for a human jaw muscle protein (MYH16). The authors suggested a deletion resulting in a pseudogene may have played a major role in allowing the cranial capacity to increase during human evolution and dated the event at 2.5 million years ago. However, such an information-losing mutation would initially be expected to produce a selective disadvantage and would likely be eliminated. Evidence from living primates and Neandertals refutes the idea that jaw muscle inversely correlates with cranial size; in fact the opposite is often true. The main effect of jaw muscle reduction would likely be in the face and jaw, not in the cranium. Further, total brain volume plays a role in determining the cranial capacity during development rather than being limited by the skull. Difficulties with the mutation rate, controversy in the calibration age and a more comprehensive study call the estimated mutation date into question. Taken together, the evidence does not support the claim that this mutation played a key role in the increased cranial capacity of man.

Figure 1. Comparison of replica mandibles from an orangutan (A), male gorilla (B), female gorilla (C), chimpanzee (D) and human (E). All of the ape mandibles are longer but narrower in the front with large canine teeth. (click for larger image)
The key problem with molecules-to-man evolution is the origin of new genetic information. According to neo-Darwinian evolution, this is ultimately from mutations or genetic copying mistakes. Indeed, evolutionists insist that no gene is ever really completely new because all genes result from the mutation or duplication of pre-existing genes.1
Note that the issue is not the size of the change, but the direction. A mutation that causes a leg to grow where an antenna should be (antennapedia) is not the slightest proof that an antenna or leg can evolve in the first place.
In March 2004, Stedman et al. claimed that a mutation reduced the jaw muscle, which allowed the braincase to enlarge in the ancestors of modern Homo sapiens.2 They discovered MYH16, a jaw-specific isoform* of the protein myosin. The protein appeared to have a mutation in all humans that they examined. This mutation resulted in a truncation of the protein that would prevent its incorporation into large bundles, resulting in a much smaller muscle. However, chimpanzees, gorillas, orangutans and macaques all express the full-length protein, which is incorporated into Type II bundles, so the jaw muscle is comparatively larger in these animals than in humans (figure 1). The authors suggest that it was the reduction in jaw muscle size that allowed a subsequent increase in the braincase, providing more room for a larger brain to follow (figure 2). They estimate that the mutation occurred 2.4 million years ago (Ma)—just prior to the alleged rise of Homo erectus/ergaster. Therefore, this mutation was supposed to be necessary for the large brain and increased intelligence of man.
* Items with an asterisk are defined in the glossary at the end of this article.
Is MYH16 a pseudogene in humans?
The first claim to examine is whether the MYH16 gene has really been mutated. The authors suggested that it is now a pseudogene* in humans. However, in this case, the mRNA for the protein is transcribed and appropriately spliced, although the protein was undetectable in the humans examined. Looking only at humans, one would not necessarily conclude that the gene is mutated at all. Mutations in humans are usually identified by finding the sequence of a non-functional or misfunctional gene and comparing it to a functional copy in other humans. Here, the mutation was found by comparing the gene to that of apes (figure 3).
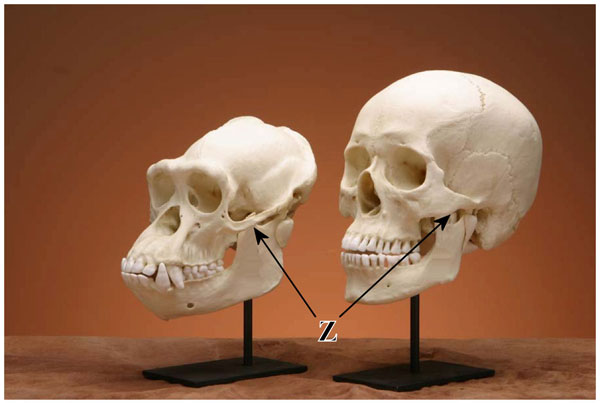
Figure 2. Comparison between chimpanzee and human replica skulls. Chimpanzees have a sloped face, large canine teeth, a longer and more robust jaw and a prominent, continuous brow ridge. The zygomatic arch (Z, arrow) is also larger in the chimpanzee to accommodate a relatively larger jaw muscle. (click for larger image)
If one assumes that humans and apes share a common ancestor, then it is clear that the human sequence has suffered a mutation since that common ancestor. However, despite the fact that the human sequence is different from all of the ape sequences, it doesn’t follow that a mutation has occurred. This is because the Creator could simply have made the human sequence different from the beginning, possibly because of a different function. In MYH16, however, the high degree of similarity downstream from the deletion does suggest that the human sequence may have been mutated. Nonetheless, we cannot be certain.
It is also possible for transcribed mRNAs to have cellular functions without being translated into proteins3 or it could play a role only during development. Until we know more about MYH16, it may be prudent to reserve judgment on whether or not it has been mutated in the human lineage. Because the mRNA for this protein is still transcribed even though the protein itself is undetected, it remains possible that the mRNA has a function independent of the protein that would be produced.
However, this gene, if not under continuous selective pressure to maintain it, might be expected to accumulate mutations. An example is the GLO enzyme in the production of vitamin C.4 Another example of a deactivated gene in humans which is still normally functional in primates is the gene for an isoform of keratin.5 A loss or alteration in expression of the MYH16 protein might also be compensated for by other myosin isoforms. For example, while in M. fascicularis (macaque) masticatory muscles, the MYH16 product is the major myosin heavy chain protein, MYH1, MYH2 and MYH7 are the ones in abundance in humans.
A mutation in MYH16, if it occurred, does not call creation into question, nor does it prove common ancestry between man and apes. Several ancient human skulls such as Homo erectus, Neandertals and Homo heidlebergensis have more robust jaws than modern humans. Larger jaws might be expected to have larger muscles to go along with them. Therefore, it is possible that MYH16 was expressed normally in these humans, contributing to their larger jaw muscle.
All mutations are not created equal
An ancient ape-like organism with a mutation in MYH16 and the correspondingly reduced jaw muscle would seem to be disadvantaged. This is because the spontaneous mutation resulting in a smaller jaw muscle would not immediately produce a larger brain and all of the other traits that we might expect for a human ancestor. Not only would this one individual with the MYH16 mutation have to survive, but it would have to pass this trait on to its offspring, ultimately with some kind of selective advantage for the trait to become so dominant. In the original paper,2 there was no mention of how this mutation was advantageous. This was noted in a News and Views article that accompanied the paper:
‘Some serious issues, however, are not fully addressed by such a model. The evolutionary acquisition of reduced jaw-muscle size needs explaining in terms of its adaptive significance, independent of any perceived role in craniofacial morphogenesis. Specifically, given the deleterious nature of the MYH mutations implicated in human disease, it is unclear how a similar change would have become “fixed” in the ancestral hominid population. Several explanations could be advanced to counter this ideological roadblock, such as a contemporaneous shift in diet (say, to an increased reliance on meat eating), or a growing dependence on hands rather than the jaw in food preparation. Stedman et al. largely ignore the issue, perhaps because it requires a separate, detailed examination. But whatever the immediate consequence of MYH16 inactivation was, it is now an indicator that a critical change occurred in the hominid masticatory apparatus around 2.5 million years ago.’6
Thus, the mutation of MYH16 on the surface appears to explain the increase in cranial capacity. However, it would do so only by almost miraculously overcoming a severe handicap. Other examples of MYH mutations or altered regulation are deleterious and are examples of forms of muscular dystrophy.7 In facioscapulohumeral muscular dystrophy, there are several muscle proteins that are misregulated, including a loss of mysosin heavy chain IIB.8
Therefore, Currie is right to question how the mutation would become fixed in the population. To become fixed, the mutation would have to convey some selective advantage for survival or reproduction.
A selective advantage is necessary—but not sufficient—for the mutation to become fixed barring unusual circumstances such as a severe population bottleneck. This is because the mutation will occur in one individual in the whole population. Because the individual with a mutant allele will be swamped by the large number of individuals without the mutant gene, it is more likely to disappear due to genetic drift. In fact, even if a gene has a 1% selective advantage, there is a 98% chance that it will eventually be lost.9 Only with some significant advantage would the frequency of the mutant gene be expected to increase in the population.
Of course one can imagine any number of ‘just-so’ stories, but they will be sorely inadequate to justify the hypothesis and account for a so-called selective advantage. This is especially problematic with Stedman et al.’s observation that the MYH16 gene ‘evolved under negative (purifying) Darwinian selection in all ancestral lineages except that leading directly to H. Sapiens.’ The conclusion from this observation is that virtually any mutation that alters the amino acid sequence of MYH16 in the apes has been eliminated from the population! Taken together, the evidence suggests that changes in protein sequence are selected against in current ape species, yet truncation and inactivation must have been selected for to eventually give rise to modern humans. This is a fortuitous mutation indeed.
Table 1. Comparison of cranial capacities of male and female apes.
From Zuckerman.38
|
Female chimpanzee |
366±6.5 cm3 |
|
Male chimpanzee |
399±7.0 cm3 |
|
Female gorilla |
466±10.4 cm3 |
|
Male gorilla |
543±4.3 cm3 |
Small jaw muscles do not increase cranial capacity
Smaller jaw muscles do not necessarily correlate to larger brains. By most estimates, the average Neandertal cranial capacity is larger than the average for modern humans in spite of the former having a larger jaw (figure 4). Other factors besides myosin isoforms are important for determining muscle size. For example, it is well established that testosterone enhances muscle strength and size without necessarily increasing muscle fibre diameter.10
It is also important to note that there is a significant difference between the skulls and jaw muscles of male and female lowland gorillas (figure 5). In fact, the male gorilla’s jaw muscles attach along the huge sagittal crest, which is only rarely present in the female. Since the MYH16 gene is not sex-linked, it is expected that there is no difference in the myosin gene between male and female gorillas. Thus, the difference in muscle size and skull morphology is not dependent solely on MYH16. Presumably, this difference arises from testosterone. If so, then muscle size would in fact play a significant role in skull morphology, but not solely due to the expression of MYH16. Moreover, female gorillas and female chimpanzees both have smaller jaw muscles than their male counterparts yet also have a smaller cranial capacity (table 1). This observation alone appears to rebut the conclusion that a mutation in MYH16 alone was responsible for increasing the cranial capacity in an alleged human ancestor.
Besides testosterone, muscle size is also dependent on use. Muscles that are used frequently can, and do, increase in size relatively quickly. In addition, bones are not static but are continuously remodelled throughout life, including changes in thickness, shape or internal structure.11 This is particularly relevant considering the fact that from birth to adulthood cranial capacity increases from 400 cm3 to 1,300 cm3 in a relatively short period of time.12
Importantly, a number of studies that examined the growth and development of the jaws have observed significant differences in size according to how hard or soft the diet was. Two groups of young ferrets were fed a diet of either hard or soft pellets.13 After six months, significant differences in cranial morphology was observed between the two groups, including the distance of the hard palate plane from the cranial base plane, angle of the canine teeth, interfrontal and interparietal widths and the size of the zygomatic arch. This study, along with others in humans, has established that there is a correlation between masticatory muscles and the morphology and growth of the skull. In a study of masseter muscle thickness and facial dimensions, it was shown that muscle thickness was negatively correlated with anterior facial height and the length of the mandible.14 Weijs and Hillen had previously reported that ‘the cross-sectional areas of temporalis and masseter muscles correlated positively with facial width, whereas the areas of masseter and pterygoid muscles did so with mandibular length’.15
While Stedman et al. were correct in their hypothesis that inactivation of a jaw muscle myosin gene could alter cranial morphology, it would appear that this would primarily affect facial dimensions and prognathism rather than cranial capacity. Individuals with longer faces have thinner masticatory muscles compared to those with shorter faces and they also have smaller maximum molar bite forces.16 Taken together, these results strongly suggest that the size of the jaw muscles (which can be impacted by diet and use) significantly contributes to various facial dimensions. Considering bone growth in conjunction with muscle size and use, the larger jaw muscles seem to shorten and widen the face but may have little impact on cranial capacity.
Creationists have long maintained that the various hominids simply represent post-Babel descendants of Adam and Eve, albeit with traits that are relatively uncommon today. Nonetheless, this possibility must be tempered by the fact that Homo ergaster (allegedly older than Homo erectus, although even many evolutionists regard it as the same species17) actually has smaller jaws and a smaller brow ridge than the supposed younger Homo erectus. Thus, the MYH16 inactivating mutation becomes even more difficult to reconcile with jaw size along the evolutionary hominid lineage.
While the MYH16 gene does appear to have been mutated and inactivated sometime in human history, it does not support the evolution of man from ape-like ancestors. At best, it provides an interesting ‘just-so’ story for the origin of man. Stedman’s study does raise the intriguing possibility that some of the differences in facial and skull morphology between Homo erectus, Homo Heidelbergensis, Neandertals and modern humans could in fact be caused by mutations or alterations in muscle proteins. It is possible that ancient humans expressed the full-length MYH16, which accompanied their more robust jaw (figure 4). The alteration in MYH16 subsequently became much more common along with the smaller jaw. In other words, some ancient human populations may have expressed the full-length protein, a trait that has subsequently been lost, along with the unique skeletal features that distinguish the various Homo specimens.

Figure 3. Comparison of DNA sequence and amino acid sequence of MYH16 exon 18 between human and the great apes. An apparent 2 nucleotide deletion (- -) in the human DNA sequence results in a frameshift and an alleged premature stop codon (*) in the amino acid sequence. The amino acid sequence of the translated human protein is different from the apes after the missing nucleotides. After Stedman et al.2 (click for larger image)
Brain volume itself may play a role in determining cranial capacity
Cranial capacity may be dependent on the size of the brain rather than the brain size being limited by the cranial capacity. Primary microcephaly is a genetic defect that results in a significant reduction in brain volume. One mutation linked to the disorder is in a gene called microcephalin, which is expressed in the brain during development.18 Since the gene is expressed only in the brain, the size of the brain itself is likely the primary factor involved in setting the cranial capacity. Interestingly, individuals with the mutated microcephalin have cerebral cortex volumes similar to those of Homo erectus.
It is also well known that hydrocephalus can lead to an enlarged head in infants if it occurs before the bones of the skull have fused. Thus, total brain volume (with cerebral spinal fluid) plays a significant role in determining the cranial capacity. Overall, facial and skull dimensions appear to result from the interaction of jaw muscle size (with contributions from diet and use) and the size of the brain. It has also been suggested that the morphology of the human cranium is likely the result of small shifts in growth of the brain and cranial base rather than major developmental changes.19
The reason for Stedman et al.’s conclusion that a decrease in jaw muscle size led to an increase in cranial capacity is not entirely clear. Taking into consideration the above studies, the size of the jaw muscles play a role in facial dimensions. However, the brain itself plays a bigger role in the cranial capacity. It would appear that there are two main pieces of evidence upon which they base their conclusion. First, apes and australopithecines have relatively larger jaw muscles and smaller cranial capacities than man. Second, the estimated date they obtained for the inactivating mutation was 2.5 Ma, just prior to the alleged rise of Homo erectus/ergaster. If so, the first is only circumstantial evidence and the second is problematic, as will be discussed below.
Brain size is not necessarily related to intelligence
A persistent myth is the notion that the intelligence of man is due solely to the larger size of the brain compared to the apes. The recent discovery of Homo floresiensis could help alter this view,20 although the wide range in cranial size of living intelligent humans should long ago have dispelled this myth. These individuals found in Indonesia are supposed to be from up to 18,000 years ago and would be contemporary with modern humans. The intriguing aspect of this find is the fact that the specimen has a cranial capacity of approximately 380 cm3. This is surprisingly less than chimpanzees and less than a third that of an average modern human. Although there is currently unresolved debate whether the specimen suffered from a genetic defect leading to the small head, the size of the rest of the body that was found appears to be in proportion with the size of the head. It appears that these small-brained individuals not only used stone tools but may have also travelled in boats or rafts. At first glance, this appears remarkable for a creature with a smaller brain than a chimp. However, it is not simply the cranial capacity that determines intelligence.
Although some studies have suggested a correlation between cranial capacity and intelligence, especially in regards to race,21 the actual relationship is much more complex. Socioeconomic differences, educational opportunities and nutrition can all play a part in intelligence. Moreover, since there are microcephalics (head size two standard deviations below the mean) with normal intelligence22 and macrocephalics (head size two standard deviations above the mean) with significantly below normal intelligence (including autism or mental retardation), clearly there is much more to intelligence than cranial capacity. For example, synaptic density, neuritic branching and other aspects of connectivity between neurons are likely to play a more important role in intelligence than the sheer number of cells in the brain.
An additional complication regarding the relationship between cranial capacity and intelligence is the fact that the total brain volume (grey matter, white matter, cerebrospinal fluid (CSF) and ventricles) can change independent of changes in the shape or size of the skull. For example, during Alzheimer’s disease there is substantial neuronal loss and the brain weight can decrease significantly while the skull does not change. After adolescence, brain volume actually decreases, even though head circumference remains constant,23 yet we don’t consider adolescents more intelligent than middle-aged adults.

Figure 4. Comparison of replica mandibles from a chimpanzee (A), Homo erectus, Peking man (B), Neandertal, La Ferrassie (C) and modern human (D). Note the similarity in shape for the human specimens (B & D). The Neandertal jaw is larger and more robust yet conforms to the overall shape. (click for larger image)
Where did the 2.5-million-year-old date come from?
Stedman et al. estimated that the MYH16 mutation occurred roughly 2.5 million years ago, which corresponds to the alleged age of Homo ergaster/erectus—both specimens which already have a relatively smaller jaw muscle than the australopithecines. But how did they arrive at this conclusion? Two pieces of information are necessary to estimate a date using DNA sequences. These are an approximate mutation rate and an inferred age to calibrate the divergence date from a common ancestor or an outgroup. Both of these values can be problematic, particularly in the case of this study.
Determining the mutation rate
Empirical measures of the mutation rate are rather difficult to obtain. Interestingly, several studies that have looked at empirical mutation rates have found unexpectedly high rates of mutation. The rates are unexpectedly high when compared with those estimated with assumed common ancestry and divergence dates. In one study, Parsons et al. compared mtDNA between mother and child, or other relatives, to determine the rate.24 The rate was significantly higher than anticipated and yielded a ‘most recent common ancestor’ for all people on Earth at 6,500 years ago. A very recent study using mathematical models showed the probability that people share a common ancestor who existed only a few thousand years ago.25 Moreover, a study that compared DNA from modern mice with mice from the same area from over a hundred years ago showed a surprisingly large change.26 Empirical mutation rates tend to be much greater than estimates that assume common ancestry but are not typically used. Of course these authors do not claim that the origin of man is as recent as creationists do. Nonetheless, these studies do provide evidence that observed mutation rates are higher than expected and further allow for the possibility of a recent human origin.
The more common way to determine the mutation rate is to compare the differences between individuals or species and then compare this to an outgroup. So, for example, in a study to determine the age of the most recent common ancestor between Neandertals and modern humans, Krings et al. determined the number of nucleotide differences between Neandertal and modern human mtDNA as well as that between modern humans and chimpanzees as an outgroup.27,28 Since Krings assumed a chimp–human common ancestor of 4–5 Ma, he determined the mutation rate as the number of nucleotide differences (chimp–human) divided by the age of the common ancestor (4–5 Ma) to get a mutation rate per million years. Armed with this mutation rate, the authors then multiplied by the number of nucleotide differences between the Neandertal and modern humans to get the estimated age of the common ancestor between these two. They obtained a date of 465 ka for this common ancestor in their first paper.
In the Krings et al. studies, they were looking at non-coding regions of mitochondrial DNA. In the Stedman paper, however, MYH16 is supposed to be an expressed protein. Expressed proteins are assumed to be subjected to selection pressure, whereas non-coding regions are not. Stedman et al. examined the ratio of synonymous mutations* to non-synonymous ones across the primate species and included dogs as an outgroup. Synonymous mutations will far outnumber non-synonymous ones if there is selective pressure. If selection is absent (as is suspected for pseudo-genes after inactivation), then the non-synonymous mutations* will accumulate at the same rate as the synonymous ones. Stedman found a high ratio of silent to amino-acid-altering (non-synonymous) mutations in dogs, macaques, orangutans and chimpanzees, but many more amino acid substitutions in the human. While this may seem very significant, it can be misleading to present the data as a mutation rate instead of the actual number. This is because there were only two non-synonymous mutations that were found out of 840 sites and two synonymous mutations out of 225 sites.29 Stedman’s date estimate is thus based on only one amino acid fixation event and this only if it is not simply an intrinsic difference between humans and chimpanzees from creation.
A more extensive analysis of the MYH16 gene has just been published. This looked at many more nucleotides, both upstream and downstream, of the alleged inactivating deletion site.29 It found several more non-synonymous mutations and thus arrived at a significantly older date for the deletion—5.3 ± 1.0 Ma. This date is more than twice Stedman’s and is much older than the oldest date assigned to any member of Homo. However, it is close to the alleged chimp–human divergence date, although Perry et al. stop short of insisting that the MYH16 deletion was not the precipitating event for divergence of the human lineage. These authors question the conclusion of Stedman that the inactivation of MYH16 led to the increased cranial capacity along the human lineage. If the Perry estimate of a 5.3 Ma date for the inactivation is more accurate, this date is also older than that typically assigned to Australopithecus, which still has the larger jaw muscle and would apparently lack the MYH16 knock-out mutation. Further, based on their calculations of the mutation rates upstream and downstream of the deletion event, they doubt the simple pseudogene model presented by Stedman.
Calibrating the divergence date
Perhaps the most intriguing aspect of the Stedman et al. date estimate was their choice of 6–7 Ma as the date for human–chimpanzee divergence. This is much older than the previous studies, such as that of Krings et al., with 4–5 Ma. Why the difference?
The older age is necessary in order to fit the MYH16 mutation into a timeframe consistent with evolutionary theory. With a chimp–human divergence date almost one third more recent, it would yield an MYH16 inactivation date closer to 1.6 Ma (well after alleged dates for Homo ergaster/erectus), and thus would not fit nicely into a human origins schema. Whether intentional or not, the older chimp–human divergence date of Stedman et al. is convenient.

Figure 5. Comparison between replica skulls of female (left) and male (right) lowland gorillas. The skull of the male is larger with a more prominent brow ridge and sagittal crest. In addition, the male has a larger face and even larger canine teeth. (click for larger image)
Stedman cites two references for using the 6–7 Ma date. Interestingly, one of these is Brunet’s find of Sahelanthropus, which was recently claimed as the oldest hominid ancestor.30 This find is not without its own controversy. The skull was claimed to have modern features such as a shorter face and small canines, which suggested it was a hominid ancestor. However, a few days after the find was reported in Nature, news reports indicated that other scientists such as Brigitte Senut thought that it was simply a female gorilla. In a detailed analysis, Milford Wolpoff and others published a thorough explanation why this was not a human ancestor at all and was in fact a female ape.31 The very features that Brunet claimed were modern and indicated it was a human ancestor are ones that can distinguish female and male gorillas. A further complication is that the 6–7 Ma estimate is based on correlation of the ‘associated fossils’.32
The second reference used molecular sequence comparisons to infer a date for chimp–human divergence based on another inactivated gene for CMP-N-acetylneuraminic acid hydroxylase.33 In this case, they assumed orangutan divergence at 13 Ma, which yielded an estimate of 5.3 Ma for chimp–human divergence. It is important to note that the date is also significantly lower than the 6–7 Ma that Stedman used, even though he cites this study in support of his older date.
Further, the orangutan divergence date has been estimated over a range of dates based on still other assumptions. For example, Andrews and Cronin determined 10 ± 3 Ma, based on a combination of fossil and molecular data.34 Hasegawa obtained 10.9 ± 1.2 Ma, assuming primates diverged from ungulates at the Cretaceous/Tertiary boundary 65 million years ago.35 In a subsequent study, they obtained 11.9 ± 1.7 Ma (9–14.8 Ma for a 95% confidence interval) using a calibration date of 38 Ma for the divergence of Catarrhini and Platyrrhini. Unfortunately, these are assumptions built on top of assumptions.
Molecular clocks are uncertain
The real problem here is that the evolutionary dates are so elastic that they can always be stretched to provide the illusion of consistency. If chimps and humans did have a common ancestor, how long ago was it? Since no-one other than God knows for sure and there are always several available dates, an age can always be found that will fit. Moreover, the fossil record is not really helpful in determining the divergence date, so the most common method used is based on estimated mutation rates. Even from the perspective of paleontology, there is always uncertainty in the date of divergence for any ancestor. This is especially true for chimp–human ancestry. Molecular-based divergence dates for this split have been published at 3.2–4.5, 5.3–5.7, 5.2–6.9 and 8.5–16.2 Ma.36 Which one is correct?
Molecular clocks have become notorious because the same gene can mutate at different rates in different species, and different genes can also mutate at different rates within the same species. Different nucleotides in the same gene can have variable mutation rates. A creationist alternative explanation for the inapplicability of the molecular clock that is typically ignored is that each kind of organism was separately created with unique molecular sequences, and therefore there is no valid clock between different types of organisms.
In a scathing review published in Trends in Genetics, Graur and Martin strongly condemn several studies that sought to determine divergence dates for many different organisms.37 They pointed out that many studies give the appearance of precision in calculating divergence dates. Scientists can calculate the number of nucleotide differences between various organisms very accurately, including an average and standard deviation. However, estimated divergence dates are only as good as the calibration to the fossil record, which is always subject to error. Further, since these estimates always assume Darwinian evolution and common ancestry to be correct, they cannot be used as evidence to support evolutionary theory. Although Graur and Martin do not doubt evolutionary theory, they point out that there is a great deal of uncertainty in molecular evolutionary divergence dates that is often ignored.
Conclusion
At first glance, Stedman’s estimated date for the inactivation of the MYH16 gene appears to fit with the alleged decrease in jaw muscle size and increased cranial capacity in human evolution, but a closer examination shows that it is far from clear cut. Stedman assumed chimp–human common ancestry and used an older than usual divergence date to obtain the convenient 2.5 Ma estimate for the MYH16 inactivating mutation. A more comprehensive study looking at substantially more nucleotides in MYH16 puts the mutation event closer to 5 Ma, thus reducing the relevance of the mutation for human evolution.
If the MYH16 gene has been knocked out, leading to smaller jaws in modern humans compared to Homo erectus, the evidence that this mutation would lead to an actual increase in cranial capacity and intelligence is questionable. Further, since there is not a real correlation between cranial capacity and intelligence, the suggestion that the MYH16 mutation played a key role in the evolution of modern humans from ape-like ancestors at this point is far fetched.
Acknowledgments
I would like to thank Les Schofer for taking the photographs of the skulls and mandibles.
Glossary
Isoform: multiple forms of the same protein with differences in amino acid sequence. These can result from completely different genes or from the same gene through alternative splicing of exons.
Pseudogene: inactive sequences of DNA which have similarity to known functional genes.
Synonymous mutation: a nucleotide change or substitution that does not lead to a change in the amino acid sequence of a protein. Many of the tRNAs will use multiple three-letter combinations for the same amino acid. This often occurs in the third codon position and is called ‘wobble’.
Non-synonymous mutation: a nucleotide change or substitution that results in a change in the amino acid sequence of a protein.
References
- Alberts, B., Johnson, A., Lewis, J., Raff, M., Roberts, K. and Walter, P., Molecular Biology of the Cell, Fourth Edition, Garland Publishing Inc., New York and London p. 20, 2002. Return to text.
- Stedman, H.H., Kozyak, B.W., Nelson, A., Thesier, D.M., Su, L.T., Low, D.W., Bridges, C.R., Shrager, J.B., Minugh-Purvis, N. and Mitchell, M.A., Myosin gene mutation correlates with anatomical changes in the human lineage, Nature 428:415–418, 2004. Return to text.
- Woodmorappe, J., Pseudogene function: more evidence, TJ 17:15–18, 2003. Return to text.
- Nishikimi, M., Kawai, T. and Yagi, K., Guinea pigs possess a highly mutated gene for L-gulono-gamma-lactone oxidase, the key enzyme for L-ascorbic acid biosynthesis missing in this species, J. Biol. Chem. 267:21967–21972, 192. Return to text.
- Winter, H., Langbein, L., Krawczak, M., Cooper, D.N., Jave-Suarez, L.F., Rogers, M.A., Praetzel, S., Heidt, P.J. and Schweizer, J., Human type I keratin pseudogene phihHaA has functional orthologs in the chimpanzee and gorilla: evidence for recent inactivation of the human gene after the Pan-Homo divergence, Hum. Genet. 108(1):37–42, 2001. Return to text.
- Currie, P., Muscling in on hominid evolution, Nature 428:373–374, 2004. Return to text.
- Rushbrook, J.I., Yuan, A.I. and Stracher, A., Abnormal myosin heavy chain variant associated with avian muscular dystrophy, Cell Motil. 1:399–416, 1981. Return to text.
- Tupler, R., Perini, G., Pellegrino, M.A. and Green, M.R., Profound misregulation of muscle-specific gene expression in facioscapulohumeral muscular dystrophy, Proc. Natl. Acad. Sci. USA 96:12650–12654, 1999. Return to text.
- The probability of survival is 2s/(1-e-2sN), where s = the selection coefficient and N is the population size. This asymptotically converges down to 2s where sN is large. Return to text.
- Griggs, R.C., Kingston, W., Jozefowicz, R.F., Herr, B.E., Forbes, G. and Halliday, D., Effect of testosterone on muscle mass and muscle protein synthesis, J. Appl. Physiol. 66:498–503, 1989. Return to text.
- Lieberman, D.E., Making behavioral and phylogenetic inferences from hominid fossils: considering the developmental influence of mechanical forces, Ann. Rev. Anthrop. 26:185–210, 1997. Return to text.
- Tobias P.V., The Brain in Hominid Evolution, Columbia Univ. Press, New York, 1971; as cited in: Lieberman, ref. 11. Return to text.
- He, T. and Kiliaridis, S., Effects of masticatory muscle function on craniofacial morphology in growing ferrets (Mustela putorius furo), Eur. J. Oral Sci. 111(6):510–517, 2003. Return to text.
- Raadsheer, M.C., Kiliardis, S., Van Eijden, T.M., Van Ginkel, F.C. and Prahl-Anderson, B., Arch. Oral Biol. 41(4):323–332, 1996. Return to text.
- Weijs, W.A. and Hillen, B., Correlations between cross-sectional area of the jaw muscles and craniofacial size and shape, Am. J. Phys. Anthropol. 70(4) 423–431, 1986. Return to text.
- van Spronsen, P.H., Weijs, W.A., Valk, J., Prahl-Andersen, B. and van Ginkel, F.C., A comparison of jaw muscle cross-sections of long-face and normal adults, J. Dental Res. 71:1279–1285, 1992. Return to text.
- Skull wars: A recent skull find in Africa made many think that it somehow ‘proved evolution’, Creation 24(4):51–53, 2002. Return to text.
- Jackson, A.P., Eastwood, H., Bell, S.M., Adu, J., Toomes, C., Carr, I.M., Roberts, E., Hampshire, D.J., Crow, Y.J., Mighell, A.J., Karbani, G., Jafri, H., Rashid, Y., Mueller, R.F., Markham, A.F. and Woods, C.G., Identification of Microcephalin, a protein implicated in determining the size of the human brain, Amer. J. Hum. Genet. 71(1):136–142, 2002. Return to text.
- Lieberman, D.E., McBratney, B.M. and Krovitz, G., The evolution and development of cranial form in Homo sapiens, Proc. Natl. Acad. Sci. USA 99:1134–1139, 2002. Return to text.
- Brown, P., Sutikna, T., Morwood, M.J., Soejono, R.P., Jatmiko, E., Saptomo, W. and Due, R.A., A new small-bodied hominin from the Late Pleistocene of Flores, Indonesia, Nature 431:1055–1061, 2004. Return to text.
- Rushton, J.P. and Ankney, C.D., Size matters: a review and new analyses of racial differences in cranial capacity and intelligence that refute Kamin and Omari, Personality and Individual Differences 29:591–620, 2000. Return to text.
- Seemanova, E., Passarge, E., Beneskova, D., Houstek, J., Kasal, P. and Sevcikova, M., Familial microcephaly with normal intelligence, immunodeficiency and risk for lymphoreticular malignancies: a new autosomal recessive disorder, Amer. J. Med. Genet. 20(4):639–648, 1985. Return to text.
- Bartholomeusz, H.H., Courchesne, E. and Karns, C.M., Relationship between head circumference and brain volume in healthy normal toddlers, children, and adults, Neuropediatrics 33:239–241, 2002. Return to text.
- Parsons, T.J., Muniec, D.S., Sullivan, K., Woodyatt, N., Alliston-Greiner, R., Wilson, M.R., Berry, D.L., Holland, K.A., Weedn, V.W. and Holland, M.M., A high observed substitution rate in the human mitochdonrial DNA control region, Nat. Genet. 15:363–368, 1997. Return to text.
- Rohde, D.L.T., Olson, S. and Chang, J.T., Modelling the recent common ancestry of all living humans, Nature 431:562–566, 2004. Return to text.
- Pergams, O.R., Barnes, W.M. and Nyberg, D., Mammalian microevolution: rapid change in mouse mitochondrial DNA, Nature 423:397, 2003. Return to text.
- Krings, M., Stone, A., Schmitz, R.W., Krainitzki, H., Stoneking, M. and Paabo, S., Neandertal DNA sequences and the origin of modern humans, Cell 90:19–30, 1997. Return to text.
- Krings, M., Geisert, H., Schmitz, R.W., Krainitzki, H. and Paabo, S. DNA sequence of the mitochondrial hypervariable region II from the Neandertal type specimen, Proc. Natl. Acad. Sci. USA 96:5581–5585, 1999. Return to text.
- Perry, G.H., Verrelli, B.C. and Stone, A.C., Comparative analysis reveals a complex history of molecular evolution for human MYH16, Mol. Biol. Evol. (Advance Access, 6 October 2004.) Return to text.
- Brunet, M. et al., A new hominid from the Upper Miocene of Chad, Central Africa, Nature 418:145–151, 2002. Return to text.
- Wolpoff, M.H., Senut, B., Pickford, M. and Hawks, J., Sahelanthropus or ‘Sahelpithecus’? Nature 419:581–582, 2002. Return to text.
- See also Murdock, M., Sahelanthropus tchadensis—the ambiguous ape, TJ 18(3):110–115, 2004. Return to text.
- Chou, H.H., Hayakawa, T., Diaz, S., Krings, M., Indriati, E., Leakey, M., Paabo, S., Satta, Y., Takahata, N. and Varki, A., Inactivation of CMP-N-acetylneuraminic acid hydroxylase occurred prior to brain expansion during human evolution, Proc. Natl. Acad. Sci. USA 99:11736–11741, 2002. Return to text.
- Andrews, P. and Cronin, J.E., The relationships of Sivaphithecus and Ramapithecus and the evolution of the orang-utan, Nature 297(5867):541–546, 1982. Return to text.
- Hasegawa, M., Kishino, H. and Yano, T., Dating of the human-ape splitting by a molecular clock of mitochondrial DNA, J. Mol. Evol. 22(2):160–174, 1985. Return to text.
- Bromhan, L., Phillips, M.J. and Penny, D., Growing up with dinosaurs: molecular dates and the mammaliam radiation, TREE 14:113–118, 1999. Return to text.
- Graur, D. and Martin, M., Reading the entrails of chickens: molecular timescales of evolution and the illusion of precision, Trends in Genetics 20:80–86, 2004. Return to text.
- Zuckerman, S., ‘An ape or the ape’, J. Roy. Anthrop. Instit. 81 (parts 1 and 2):63, 1952, as cited in Custance, A., Evolution or Creation? Vol. IV, Zondervan, Grand Rapids, MI, p. 223,1976. Return to text.
Readers’ comments
Comments are automatically closed 14 days after publication.