
Journal of Creation 15(3):39–42, December 2001
Browse our latest digital issue Subscribe
Do Greenland ice cores show over one hundred thousand years of annual layers?
Uniformitarian scientists claim to have counted 110,000 annual layers of ice down one of the ice cores drilled into the central Greenland ice sheet, but this claim is incorrect. They have used predictions from their long-age ice-accumulation models to interpret ‘annual’ layers using variables such as oxygen isotope ratios, cloudy bands, electrical conductivity, laser-light scattered from dust, major ion chemistry, and volcanic ash bands. Creationists view the lower portion of the ice sheet as accumulating rapidly during a 700-year Ice Age, while the upper portion represents accumulation in the 4,000 years since the Ice Age. Annual layers in the very top section of the core are easily interpreted from the ratio of oxygen isotopes, and creationists agree with these interpretations. Below this top section, the annual layers interpreted from the two models diverge significantly. Rather than annual layers in the uniformitarian model, the changes in the parameters represent multiple variations within a single year, and sometimes variations over a few days.

Ice cores have been drilled deep into both the Antarctica and Greenland ice sheets. These cores represent snowfall that has turned to ice. As snow falls on top of the ice sheets, dust, air, acids, etc. are added and eventually incorporated into the ice. Some of these parameters vary noticeably between seasons, providing a ‘signature’ for recognising each annual layer of snowfall. The annual snowfall over Antarctica is normally too small to resolve annual layers down an ice core. It is the Greenland ice sheet that exhibits annual cycles of one or more of the variables down an ice core.
Glaciologists claim that they can count 110,000 annual layers downward from the top to near the bottom of the Greenland ice sheet.1 This analysis was performed on the American GISP2 (Greenland Ice Sheet Project 2) ice core drilled between 1989 to 1993 from the top of the ice in central Greenland to bedrock at about 3,000 m deep.2 The GRIP (Greenland Ice-core Project) core was drilled nearby at the same time by a European team. It is further claimed that the basal ice is 250,000 years old,3 or possibly 2.4 million years, back to the time of the original buildup of the ice sheet.4 This is obviously much too old for the 6,000-year Biblical time scale. Is their claim of so many annual layers justified?
One of the variables most used to identify annual layers in the Greenland ice cores is the oxygen isotope ratio in the ice. Oxygen has three isotopes, each with a different number of neutrons in the nucleus of the atom. For ice core analysis, the ratio between oxygen-18 and oxygen-16 is used, oxygen-17 being too small for practical purposes. Oxygen-18 has a higher mass than oxygen-16 because it has two more neutrons. The difference in mass means that the ratio of these isotopes will change when water evaporates or condenses, and the degree of change depends on the air temperature. During summer, with warmer temperatures, the ratio of oxygen-18 to oxygen-16 in snowfall is higher, while in winter the ratio is lower. This seasonal oscillation in the oxygen isotope ratio can be measured down Greenland ice cores. Furthermore the oxygen isotope ratio can indicate which ice in the core formed during the Ice Age and which ice formed afterwards.
I will show that the interpretation of annual layers is good near the top of the ice cores, but becomes increasingly in error lower down the core. This is because uniformitarian scientists believe the ice sheet is millions of years old and has remained in equilibrium at about the same height and shape for the last few million years. Thus they consider that each annual layer has gradually moved deeper into the ice sheet, becoming greatly compressed in the process. The large number of annual layers they obtain is simply an outgrowth of their extended time scale.
On the other hand, creationists view both the Greenland and Antarctica Ice Sheets as products of a post-Flood rapid Ice Age, plus the ice added after the Ice Age.5 In this model, annual layers would be very thick in the lower portion of the Greenland ice sheet (the Ice Age portion determined by the oxygen isotope ratio). Higher in the ice sheet the annual layer thickness would decrease. Since the Ice Age ended about 4,000 years ago, the compression of the ice sheet has been much less than uniformitarian scientists believe, but still substantial.6 So, one annual layer deep in the ice sheet may be interpreted by uniformitarians as 100 or even 1,000 ‘annual cycles’. However, instead of annual cycles, the oscillations simply represent variations within a single year.
Uniformitarian and creationist views of the present ice sheets

Uniformitarian scientists believe the Earth is billions of years old. As a result, they believe that ice ages have recurred in cycles many times over the last 2 to 3 million years. Thus, they assume that the Greenland and Antarctica ice sheets have existed for many millions of years. Furthermore, they believe these ice sheets have more or less maintained their present height in a state of equilibrium during all this time. They think the amount of snow and ice added each year has been approximately balanced by the ice that is lost by melting and calving of icebergs into the ocean. The weight of the ice causes vertical compression and horizontal flow, since ice behaves like a viscous fluid (Figure 1). From these assumptions, they have developed flow models of the ice sheets with the annual layers thinning to paper-thin near the bottom (Figure 2).
These assumptions and interpretations result in a vastly different history of the ice sheet from that of a post-Flood rapid ice age model.5 Because this flow model requires millions of years, they have deduced that the bottom of the ice sheet is around 250,000 years or older. Even older ice may exist, they believe, but it is presumed to be too thin to resolve, because the ‘annual’ layers would be paper-thin, and this ice would presumably have mixed with ice of other ‘ages’.
In the creationist model the ice over Greenland and Antarctica built rapidly for about 500 years during a speedy ice age.5 Then the amount of snowfall tapered off during the next 200 years of deglaciation. The amount of snowfall would generally be proportional to the temperature of the North Atlantic Ocean, the height of the building ice sheet, and proximity to the main storm tracks.
On the Greenland ice sheet, however, the current snow accumulation is more complicated. In western Greenland, accumulation increases with altitude up to about 1,500 m and then decreases from 1,500 to 3,000 m. One can loosely apply this snowfall-height record to ice sheet buildup, but there are additional problems, such as warmer temperatures and different atmospheric circulation. Essentially, as the ice sheet increased up to 1,500 m, snowfall would increase on top of the ice sheet with altitude, all other factors being the same. As the ice sheet increased from 1,500 to 3,000 m, the snowfall would decrease the higher the ice sheet.
Thus, during the 700-year post-Flood Ice Age, the oceans would have gradually cooled and the ice sheet thickened with time. Since the Ice Age ended about 4,000 years ago, precipitation would continue to build the thickness of the ice sheet. This precipitation would be greater immediately after the Ice Age because the ice sheet would have been thinner than it is today.
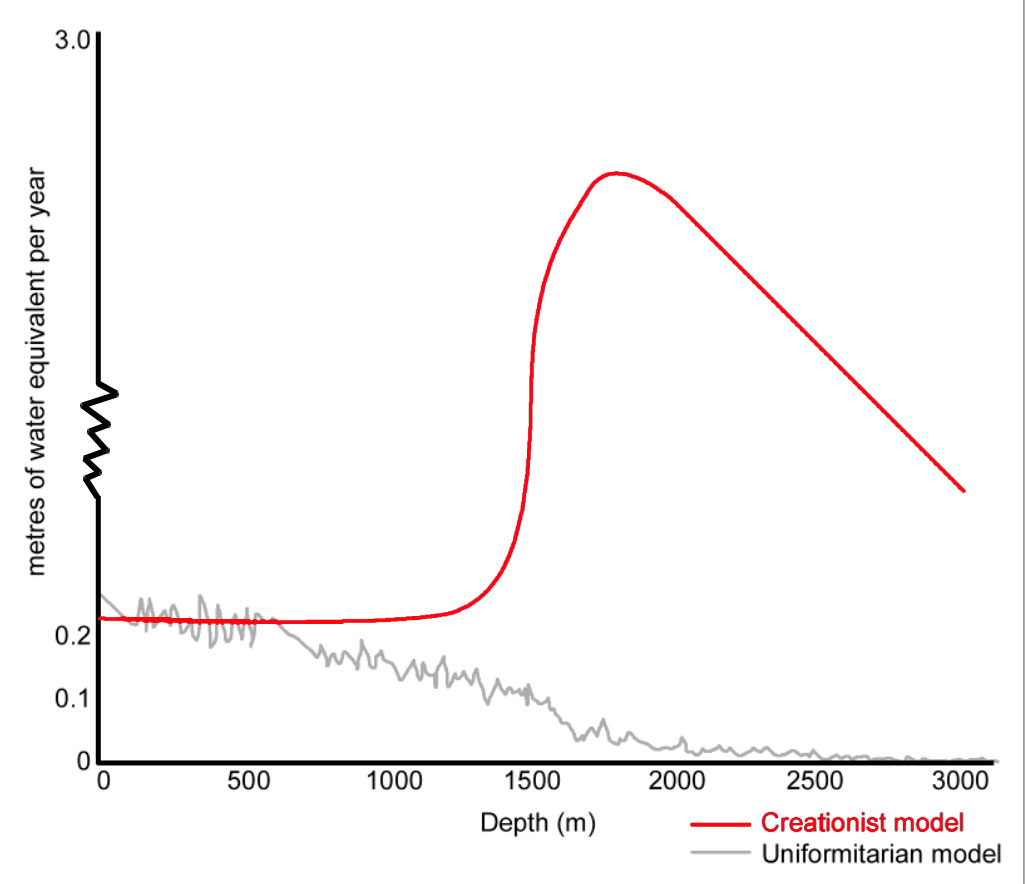
During all the time since the Flood, the ice sheet would continue to compress vertically and stretch horizontally (Figure 1), but this would be much less than in the uniformitarian model. Annual layers would be quite thick in the Ice Age portion of the Greenland ice cores (approximately the lower half of the 3,000 m thick GRIP and GISP2 cores). In the upper portion of the ice sheet, which represents ice accumulated after the Ice Age, the annual layers would decrease in thickness. The annual layer before compression for the Ice Age portion of the core would probably average around 6 m of water equivalent per year at this location in Greenland. (From the Ice Age portion of other Greenland ice cores it is estimated that the other areas of Greenland would have had a lower accumulation.) The estimated thickness of the preserved annual ice layers down the GRIP ice core of central Greenland for the uniformitarian7 and creationist models is shown in Figure 3. The creationist estimate of currently preserved annual layers is based on: 1) high accumulation during the Ice Age; 2) decreasing accumulation after the Ice Age as the ice sheet continued to thicken; and 3) compression caused by the weight of the ice above. Vardiman6 has worked out these variables for the Camp Century ice core in northwest Greenland.
How uniformitarians obtain annual layers from the ice cores
From their flow models, uniformitarian scientists estimate the anticipated thickness of each annual layer from the top of the ice to near the bottom. At the top, the annual layers represent about 800 mm of compacted snow, which will compress into 240 mm of ice.8 These annual layers show up quite well near the top of the ice core. Uniformitarians and creationists agree that these measurements represent annual layers. However, after compression, the annual layer thickness of each model, shown in Figure 3, soon diverges significantly, and the agreement ends. For example, 2,000 m down the GISP2 Greenland ice core, the assumed annual layer thickness from the uniformitarian model would be about 20 mm,9 whereas the creationist estimate would be around 2,000 mm, 100 times more.
The assumed thickness of the annual layers is important because it determines how many measurements of each variable are made down the length of the core. Based on their expected annual thickness, uniformitarian scientists take enough measurements to resolve what they believe are annual cycles. For oxygen isotope oscillations, they normally need eight measurements per annual cycle to pick up the ‘annual’ signature. However, from oxygen isotope measurements they were only able to resolve annual layers in the GISP2 core down to about 300 m although annual layers have supposedly been identified at significantly deeper levels in other Greenland cores.10 So they have used other variables, such as cloudy bands, electrical conductivity, laser-light scattered from dust, major ion chemistry, and volcanic ash bands, to establish the ‘annual’ layers.11,1 Significantly, their interpretation of annual layers from these variables has been determined by the thickness of the annual layers that they expect, based on their model.
How do creationists explain the oscillations observed in these variables in the lower portion of the ice cores? Within the uniformitarian model, the amplitude of each variable within an ‘annual’ layer tends to be smoothed out by molecular diffusion over time as the layer is compressed. Within the creationist model, there has not been time for much diffusion. However, the climate during the Ice Age would have had warmer winters and cooler summers, which would lessen the amplitude of the annual oscillation. So, I would expect lower amplitude annual oscillations in ice core variables during the Ice Age, especially with the oxygen isotope ratio.
Furthermore, at the time the snow was building during the Ice Age the elevation of the ice sheet would have been lower and the air temperature warmer. This would have produced more melt or hoar-frost layers (cloudy bands), which is one of the variables uniformitarians used to determine the annual layers. Therefore, what uniformitarian scientists are claiming as annual variations are simply oscillations that occur within a single year.
In the creationist model, the oscillations in the variables used by uniformitarians to determine annual layers could have been produced within a single year. Indeed, uniformitarians understand that very short-term oscillations, representing as little as a day or two, show up in the variables.12 For example, a storm has a warm and cold sector that produces significant fluctuation in each of the variables and these storm oscillations may be on the order of several days. Even uniformitarians recognise that these storms can produce problems for counting annual layers, as Alley et al. state:
‘Fundamentally, in counting any annual marker, we must ask whether it is absolutely unequivocal, or whether nonannual events could mimic or obscure a year. For the visible strata (and, we believe, for any other annual indicator at accumulation rates representative of central Greenland), it is almost certain that variability exists at the subseasonal or storm level, at the annual level, and for various longer periodicities (2-year, sunspot, etc.). We certainly must entertain the possibility of misidentifying the deposit of a large storm or a snow dune as an entire year or missing a weak indication of a summer and thus picking a 2-year interval as 1 year.’13
Besides the subannual layers caused by precipitation factors, subannual layers can also be produced by other factors such as snow dunes.
Adding to the problems of estimating the number of annual layers is the fact that cold or warm weather patterns can run in cycles, anywhere from a week to even a season. These cold or warm spells, which are typical today at mid and high latitudes, also cause oscillations over periods of a month or longer.14
Conclusion
Uniformitarian scientists interpret variations in measured parameters below the top section of a central Greenland ice core as ‘annual’ cycles. This interpretation is based on their long-ages model with an ice sheet in equilibrium for several million years. So they manage to ‘squeak out’ 110,000 years of ‘annual’ cycles by using several parameters. However, the cycles can be produced by subannual oscillations in the parameters. Thus, the creationist young-Earth model, including a rapid ice age, is just as viable if not more so.
References and notes
- Meese, D.A., Gow, A.J., Alley, R.B., Zielinski, G.A., Grootes, P.M., Ram, K., Taylor, K.C., Mayewski, P.A. and Bolzan, J.F., The Greenland Ice Sheet Project 2 depth-age scale: methods and results, J. Geophysical Research 102(C12):26411–26423, 1997. Return to text.
- Oard, M.J., A tale of two Greenland ice cores, J. Creation 9(2):135–136, 1995. Return to text.
- Dansgaard et al., Evidence for general instability of past climate from a 250-kyr ice-core record, Nature 364:218–220, 1993. Return to text.
- Souchez, R., The buildup of the ice sheet in central Greenland, J. Geophysical Research 102(C12):26317–26323, 1997. Return to text.
- Oard, M.J., An Ice Age Caused by the Genesis Flood, Institute for Creation Research, El Cajon, 1990. Return to text.
- Vardiman, L., Ice Cores and the Age of the Earth, Institute for Creation Research, El Cajon, 1993. Return to text.
- De Angelis, M., Steffensen, J.P., Legrand, M., Clausen, H. and Hammer, C., Primary aerosol (sea salt and soil dust) deposited in Greenland ice during the last climatic cycle: comparison with east Antarctic records, J. Geophysical Research 102(C12):26681–26698, 1997; p. 26683. Return to text.
- Meese et al., Ref. 1, p. 26411. Return to text.
- De Angelis et al., Ref. 7, p. 26683. Return to text.
- Meese et al., Ref. 8, p. 26412. Return to text.
- Alley et al., Visual-stratigraphic dating of the GISP2 ice core: basis, reproducibility, and application, J. Geophysical Research 102(C12):26367–26381, 1997. Return to text.
- Grootes, P.M. and Stuiver, M., Oxygen 18/16 variability in Greenland snow and ice with 10-3-to 105-year time resolution, J. Geophysical Research 102(C12):26455–26470, 1997. Return to text.
- Alley et al., Ref. 11, p. 26378. Return to text.
- Shuman, C.A., Alley, R.B., Anandakrishnan, S., White, J.W.C., Grootes, P.M. and Stearns, C.R., Temperature and accumulation at the Greenland summit: comparison of high-resolution isotope profiles and satellite passive microwave brightness temperature trends, J. Geophysical Research 100(D5):9165–9177, 1995. Return to text.
Readers’ comments
Comments are automatically closed 14 days after publication.