

Journal of Creation 35(3):103–108, December 2021
Browse our latest digital issue Subscribe
Ice core oscillations and abrupt climate changes: part 5—the early Holocene green Sahara
The Sahara Desert is very hot and dry today, but during the Ice Age lakes and streams were abundant in now dry areas across the earth around 30°N and 30°S. The southwest United States is semi-arid today, but during the Ice Age there were numerous large lakes, even in Death Valley. These lakes were associated with the Ice Age, since shorelines from the pluvial lakes etched end moraines in some locations. Abundant evidence shows that the Sahara Desert was also well-watered, and not that long ago. Numerous carbon-14 dates, which creation scientists can generally use in a relative sense, show that the wettest time, the African Humid Period (AHP), was after the Ice Age. Uniformitarian scientists do not know the cause of the AHP. But with glacial maximum at about 1,000 years after the Flood in Antarctica and the surrounding ocean, the Intertropical Convergence Zone (ITCZ) could easily be pushed more than 600 km farther north than it averages today, causing the green Sahara.
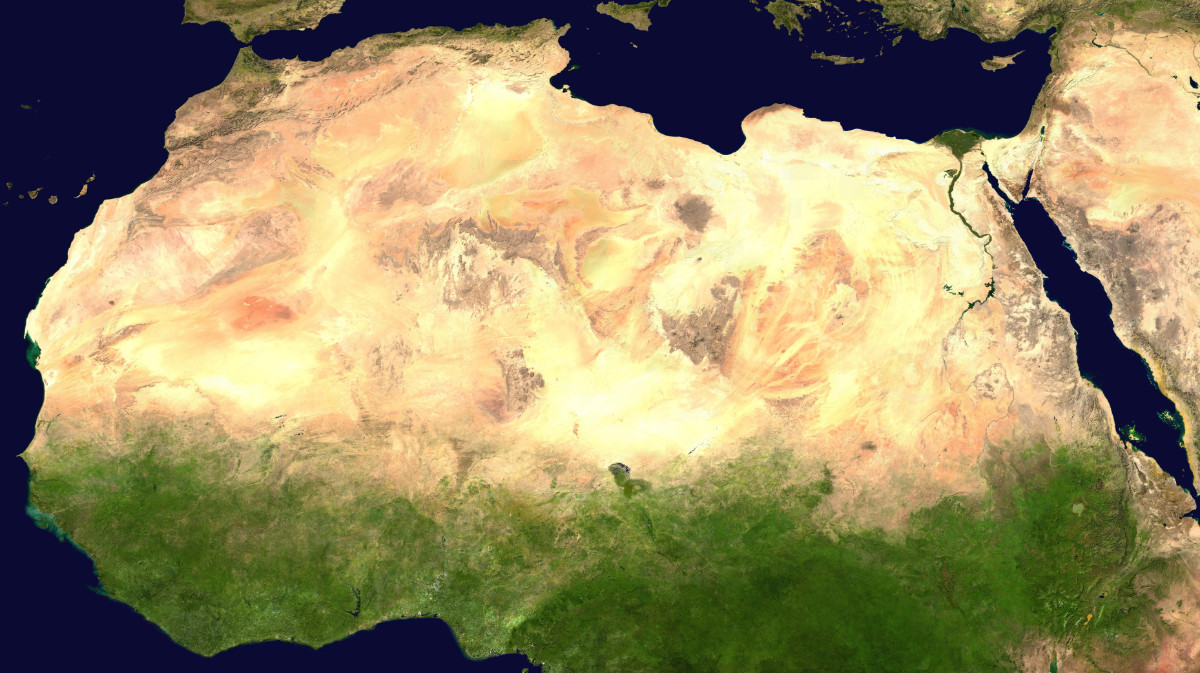
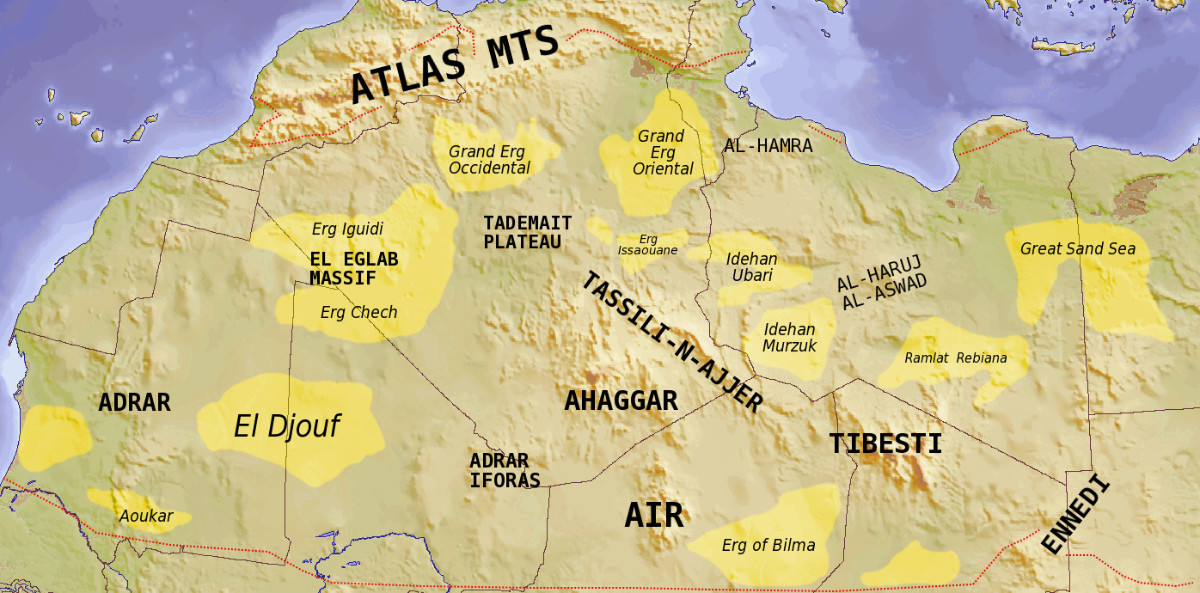
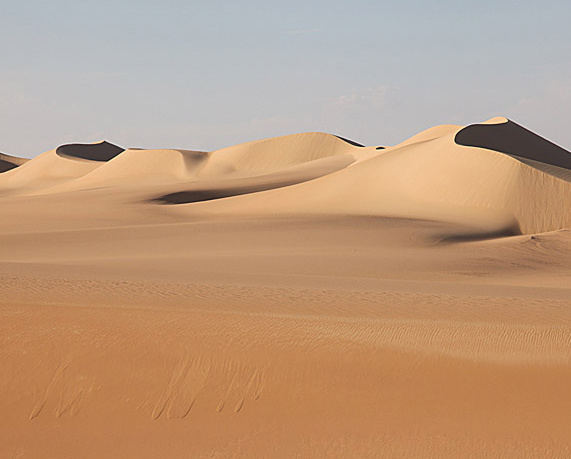
The Sahara Desert of northern Africa is one of the driest and hottest locations on Earth (figure 1). It rains in the eastern Sahara once every 30–50 years. The Sahara Desert covers about 9,200,000 km2 and is comparable to the size of the United States. It is divided into several regions by high mountain ranges, such as the Ahaggar and Tibesti Mountains (figure 2). Some 74% of the Sahara is covered by sand with several large ‘sand seas’, such as the Great Sand Sea of eastern Libya and western Egypt, which covers 72,000 km2 (figure 3). Not counting the Atlas Mountains of northwest Africa, the highest peak in the Sahara Desert is Emi Koussi, in the Tibesti Mountains. Its elevation is 3,445 m. The mountainous areas of the Sahara have oases with playa lakes. Playa lakes are generally dry and free of vegetation. If precipitation is high enough, they occasionally have water.
South of the desert is an east–west belt called the Sahel. It is a semi-arid tropical savanna, which alternates between wet and dry cycles depending upon to the exact location of the Intertropical Convergence Zone (ITCZ). A massive drought that occurred from the late 1960s to the early 1980s killed 100,000 people and left 750,000 people depending on foreign food aid (out of a population of about 50 million people).
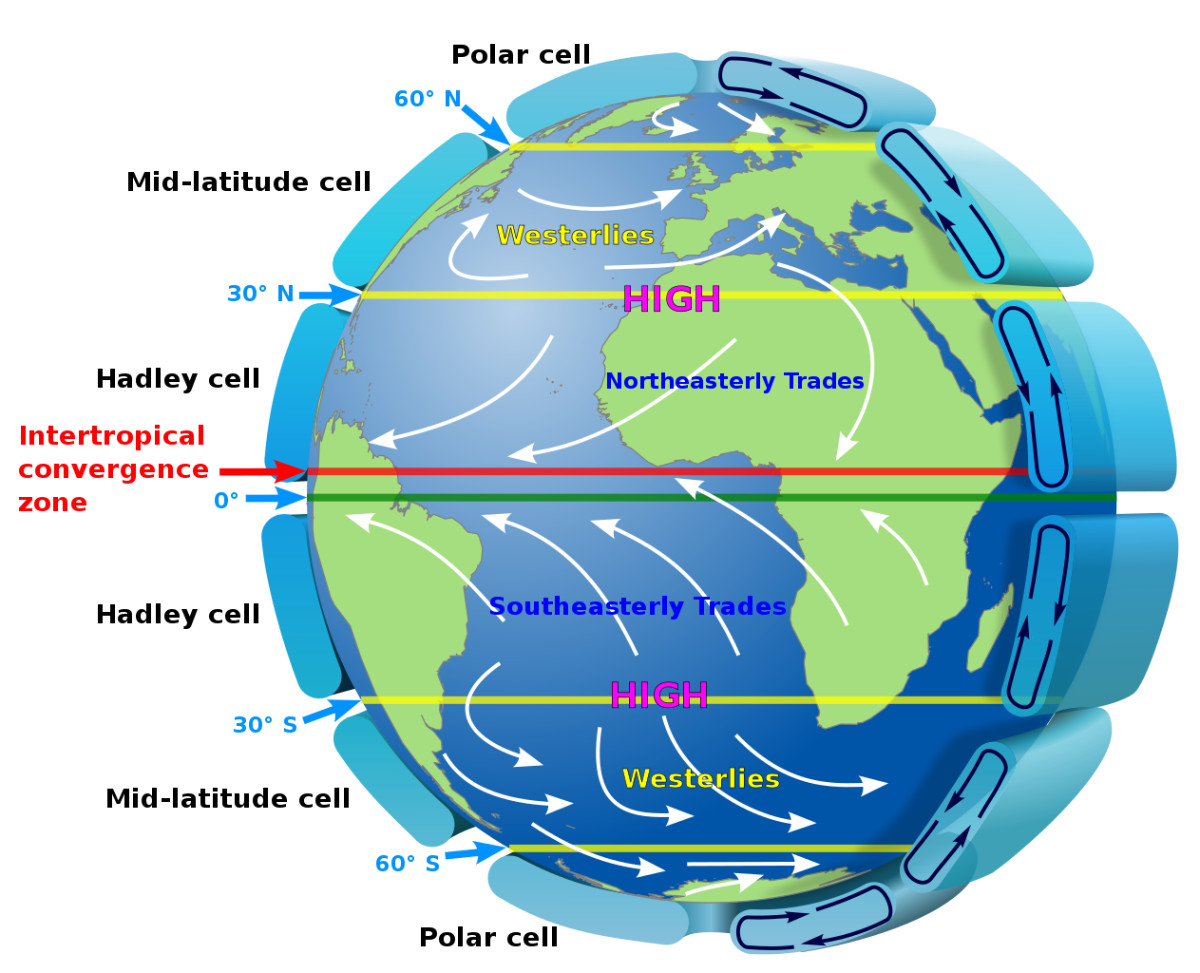
South of the savanna is central Africa, where tropical rain forests flourish due to the presence of the ITCZ. The ITCZ is formed by the general circulation of the atmosphere in which air sinking at 30° south and north, where deserts and semi-arid areas are located today, hits the surface or surface layer. The air in this layer is forced to spread toward the pole and toward the equator. The air spreading to the equator from around 30°N and from 30°S converges near the equator, forcing the air to rise (figure 4). Rising air is the cause of practically all precipitation. So, this rising air near the equator becomes a rain belt. Precipitation is about 1.7 m per year.
Present arid and semi-arid areas well-watered during the Ice Age
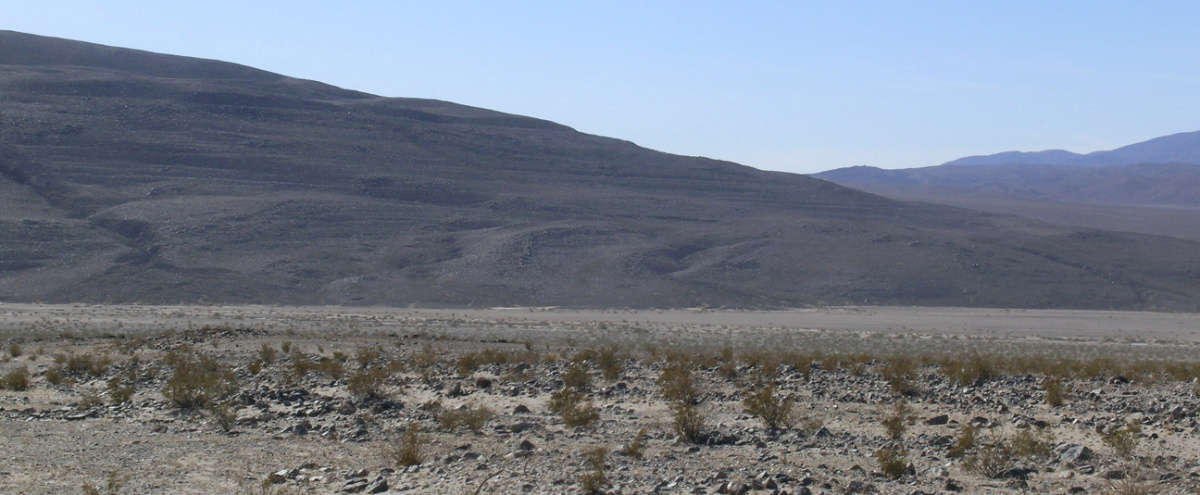
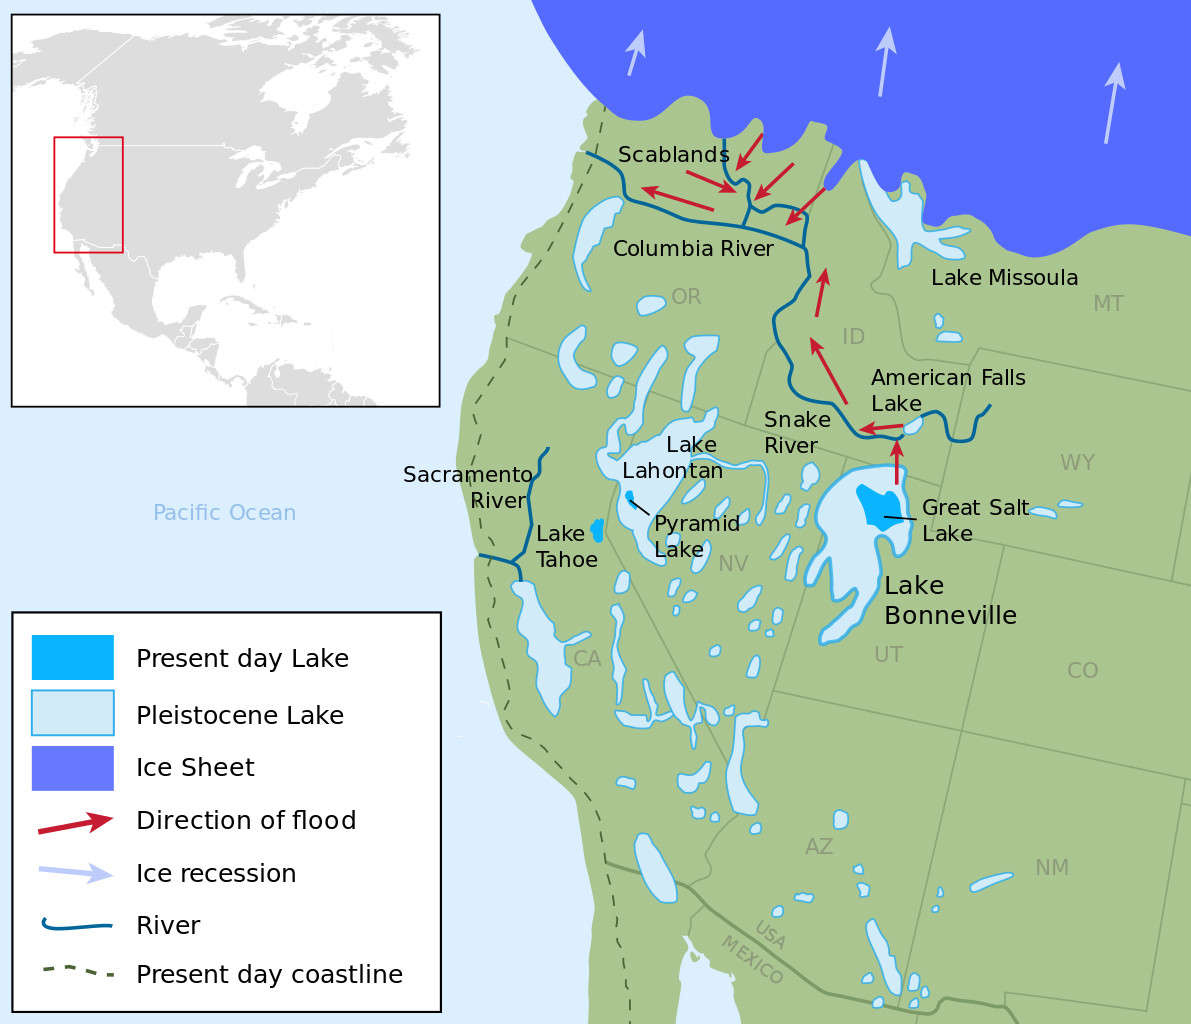
Both creation and secular geologists agree that the earth’s deserts and semi-arid areas were once well-watered,1,2 for instance in the Southwest US (figure 5). Creation scientists attribute the early filling of these lakes to the ponding of water in enclosed basins during the runoff stage of the Flood. The lakes grew and were sustained by Ice Age precipitation along with a network of rivers and streams. During this time the Great Salt Lake in Utah, USA, on average 3.7 m deep today, was about 12 times its current area and about 325 m deep.3 Measuring ancient shorelines in Death Valley, California, USA, shows a lake once filled Death Valley 180 m deep (figure 6).3 Today Death Valley is one of the hottest, driest places on Earth with the world record high temperature.4
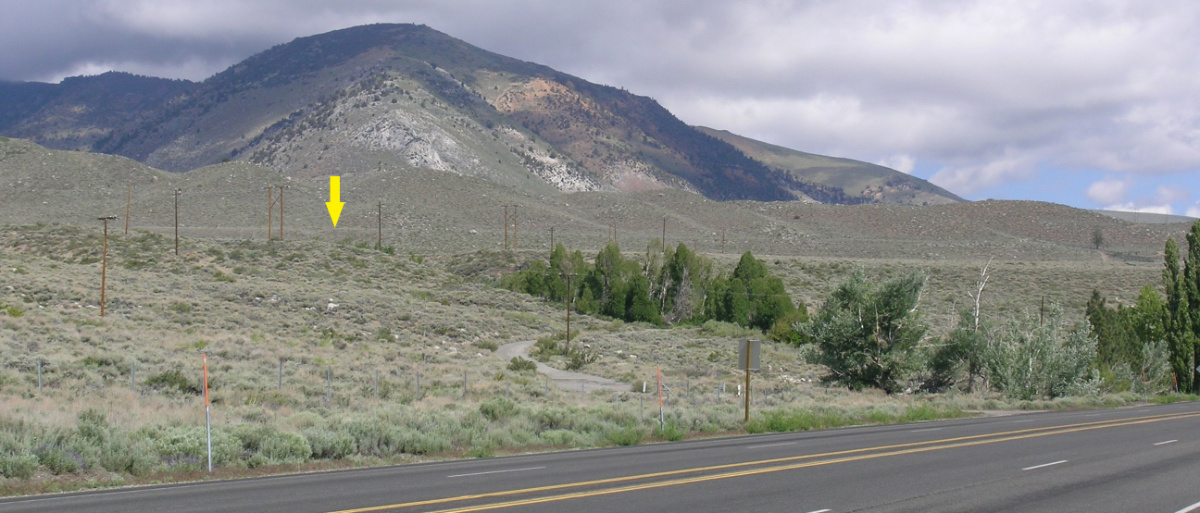
We know that these lakes were associated with the Ice Age, since shorelines of ancient Lake Russell cut through an end moraine from a valley glacier descending from the eastern Sierra Nevada Mountains (figure 7).5 Lake Russell was 242 m deeper than the 1975 level of Mono Lake, a salt lake in the Bishop Valley of east-central California. Because this end moraine was not deformed after the shorelines were carved, the ice must have been melting at the time the shorelines were carved.
The Sahara Desert was also well watered
As hard as it is to believe, the Sahara Desert also was once well watered. Field research and satellite pictures suggest evidence of lakes and rivers, now mostly buried beneath the sand.5-7 Paleolake Chad was much larger than Lake Chad today, covering an area of 340,000 km2.8 However, some researchers suggest that there were no large lakes other than Paleolake Chad, but instead wetlands and small lakes. This suggests that the wet Sahara may not have been as wet as some suppose.9 Regardless, this period has been called the African Humid Period (AHP).
Natives, archaeologists, and collectors have found countless artifacts from the Ice Age and fossils of elephants, giraffes, buffaloes, antelopes, rhinoceroses, and other animals. Even aquatic animals, such as the hippopotamus, astonish collectors.10 This is the kind of diversity seen today in the African Serengeti. Dwarf Nile River crocodiles have been found as recently as the early 20th century in isolated lakes or pools in oases of the high western Sahara,11,12 which indicates that the Sahara was wet not that long ago.
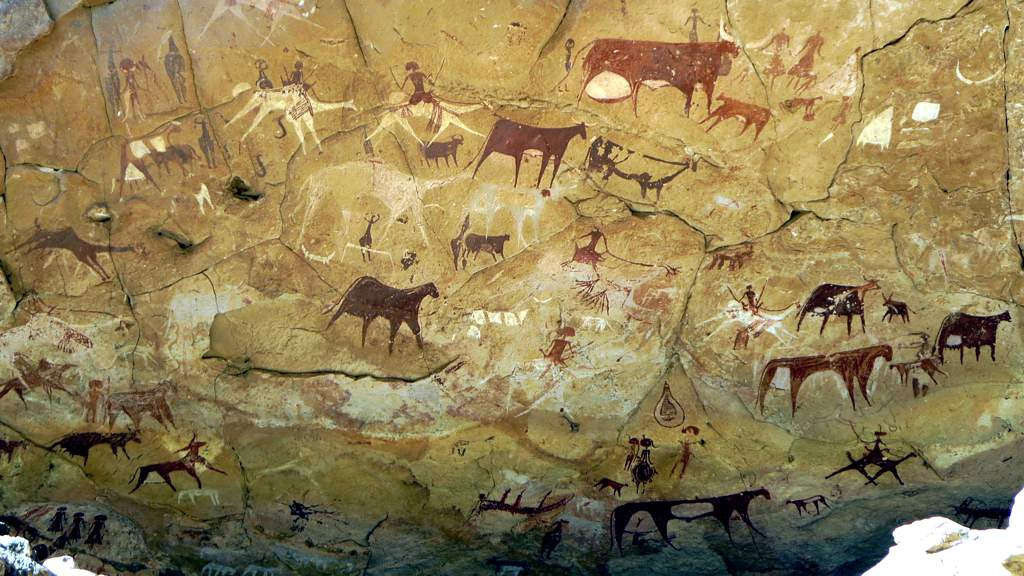
Judging by the thousands of rock petroglyphs (figure 8), the population of the Sahara was quite large. James Wellard states:
“The Sahara is a veritable art gallery of prehistoric paintings. … The evidence is enough to show that the Sahara was one of the well-populated areas of the prehistoric world. … Yet there is this work, in the most inaccessible corners of the desert, literally thousands of figures of tropical and aquatic animals, enormous herds of cattle, hunters armed with bows and boomerangs, and even ‘domestic’ scenes of women and children and the circular huts in which they lived.”13
Others corroborate:
“Occupation is clearly testified in the frequent rock engravings that are scattered throughout the upland regions of the desert, illustrating a lush environment with Sahelian and riverine fauna and scenes of large-game hunting, livestock herding and religious ceremony.”14
The wettest period was after the Northern Hemisphere Ice Age
The timing of the AHP has been debated, but scientists generally believe it started about 15,000 bp, which is during deglaciation in their ‘last’ ice age.15,16 Before that date, the data become sketchy and were based on questionable uniformitarian dating systems. As far as they know, the period of greatest wetness is actually believed to have come after the Ice Age.15,16 Based on 3,287 carbon-14 dates from 1,011 human archaeological sites, man was in northern Africa after the Ice Age, 10,500–5,500 years ago, according to the uniformitarian timescale. Taking carbon-14 in a relative sense, these dates correspond to deglaciation and the early- to mid-Holocene, after the Ice Age. This seems to conflict with the timeline of other wet areas, which are now semi-arid areas or deserts, which developed during the Ice Age.
Uniformitarian scientists stumped
Secular scientists really do not know why the AHP occurred. It is assumed that the ITCZ moved north. It would have to have moved 1,600 km or more for the Sahara to be a tropical rainforest, like in central Africa near the equator. It is more likely that it moved north significantly less, but this would have depended upon how wet the Sahara actually was. There is some debate on the degree of wetness. Maybe it was as wet as, or a little wetter than, the Sahel today. This would mean the northward shift of the ITCZ was more like 600 km or a little more than the average location today. This represents a northward movement of the ITCZ at least 5° but up to as much as 15° latitude northward. The ITCZ is related to the current general circulation of the atmosphere (figure 4), and scientists do not know how or why it could be decoupled from the general circulation and moved farther north during the AHP.17,18
Some climate simulations claim modest success in moving the ITCZ a little farther northward due to Milankovitch fluctuations and the increase in greenhouse gases.15 One wonders how slight changes in the earth’s radiation balance caused by the Milankovitch mechanism19 and an increase in carbon dioxide after the Ice Age would produce an ITCZ significantly farther north than it is today. Carbon dioxide is significantly higher today than it was immediately after the Ice Age, and it was about 100 ppm lower before the industrial revolution, and the ITCZ was little affected.
Thus, uniformitarian scientists have great difficulty explaining the green Sahara, as well as ‘wet’ deserts everywhere. Their Ice Age models end up with a very cold and drier climate than we have today.20 The most significant problem uniformitarian scientists face is how to reconcile this principle that the colder the air, the less moisture it can hold. An Ice Age requires abundant precipitation.1,21
Uniformitarian scientists need precipitation not only to cause an ice age but also to find a way to fill the pluvial Ice Age lakes. They hope to find some combination of cooler temperatures which results in less evaporation, and yet adds greater precipitation. The following calculations further elucidate their challenge. For the southwest United States, a cooling of 10°C would reduce the evaporation by about 50%.22 But the runoff would need to be 2–10 times the current runoff for a long period of time to fill these lakes—a very difficult scenario. Ibarra et al. conclude for the Southwest United States:
“The late Pleistocene landscape of the western United States was characterized by vast lake systems indicative of a hydrological balance dramatically different from the present … . In addition, the precise connection between lake levels and climate factors has proven challenging to establish, because the relationships among the physical and hydrologic controls on measured variables and past climatic studies are unresolved.”23
The evaporation rate in Australian Lake Eyre today is 240–360 cm/yr. Evaporation would have to fall to an unrealistic low of 50 cm/yr with a constant inflow of 6,000 m3/sec over many years to maintain mega-Lake Eyre.24 This seems very unlikely.
Glacial maximum Southern Hemisphere about 1,000 years after the Flood
I believe the cause of the African Humid Period is that the Ice Age lasted longer in the Southern Hemisphere than the Northern Hemisphere. I believe that glacial maximum was reached about 1,000 years after the Flood in Antarctica and the surrounding ocean because the Antarctica Ice Sheet continued to grow. The large rise in deuterium isotope oscillations in the Antarctic ice cores and the similar large rise in the Greenland ice cores are correlated and were likely caused by the melting of the ice sheets, except Greenland, in the northern hemispheres. The ice caps over South America, Tasmania, and New Zealand decreased at this time.
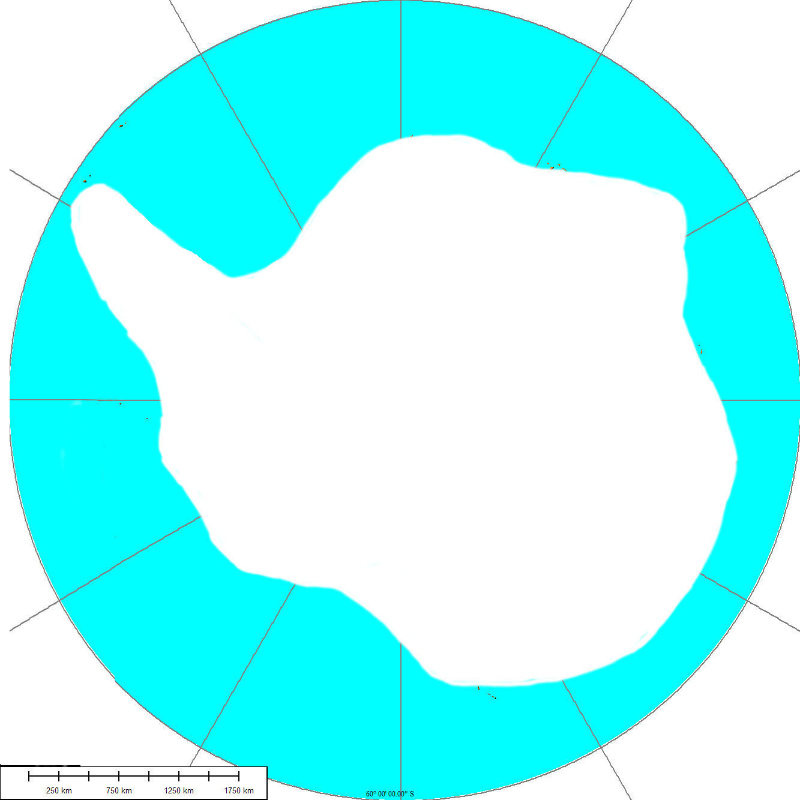
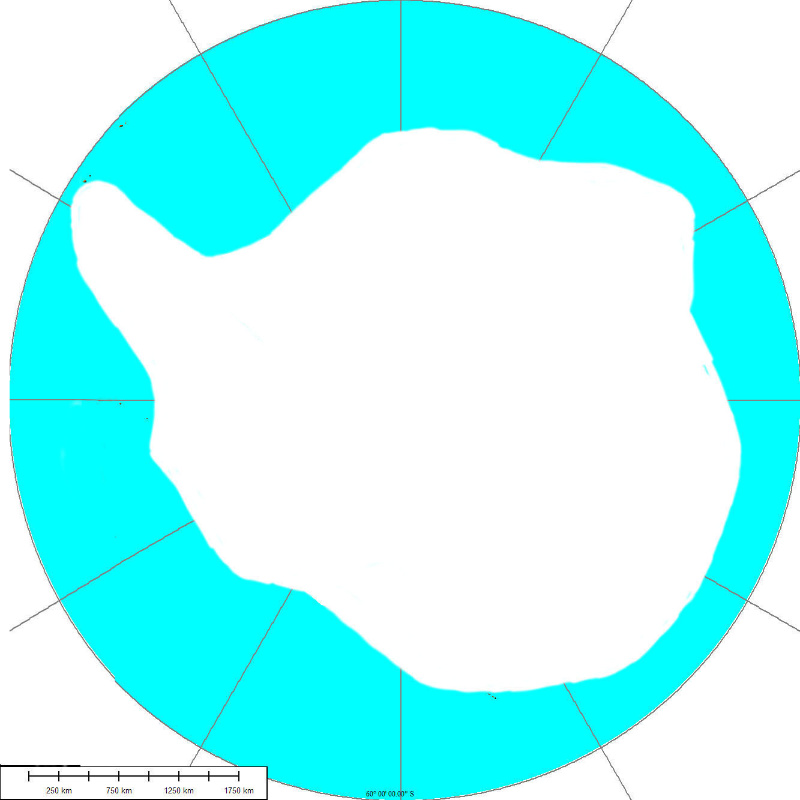
The Antarctic ice sheet did not grow upward much after 500 years, but it pushed farther out onto the continental shelf and thickened in the coastal area. Sea ice would have formed each winter farther north. Figures 9 and 10 show the area of ice after 750 and 1,000 years, respectively. So, post–Ice Age accumulation on the top of the Vostok and Dome C ice cores was 300 m and 400 m, respectively, in 4,000 years. This represents an average post–Ice Age accumulation of 7.5 cm and 10 cm/yr, respectively. More accumulation occurs at Dome C, likely because it is closer to the ocean than Vostok. These values compare with the uniformitarian estimate today of about 5 cm/yr. However, 5 cm/yr likely assumes that the Holocene was about 10,000 years long. It is unlikely that scientists can accurately measure the annual average, since the snow blows around so much.
The later glacial maximum of 1,000 years after the Flood in the Southern Hemisphere resulted from the differences in the land/ocean distribution between hemispheres. With a larger supply of warm water in the Southern Hemisphere, the southern oceans took longer to cool. Ice continued to build up in the coastal areas with little accumulation at inland locations. Sea ice kept spreading farther northward until glacial maximum.
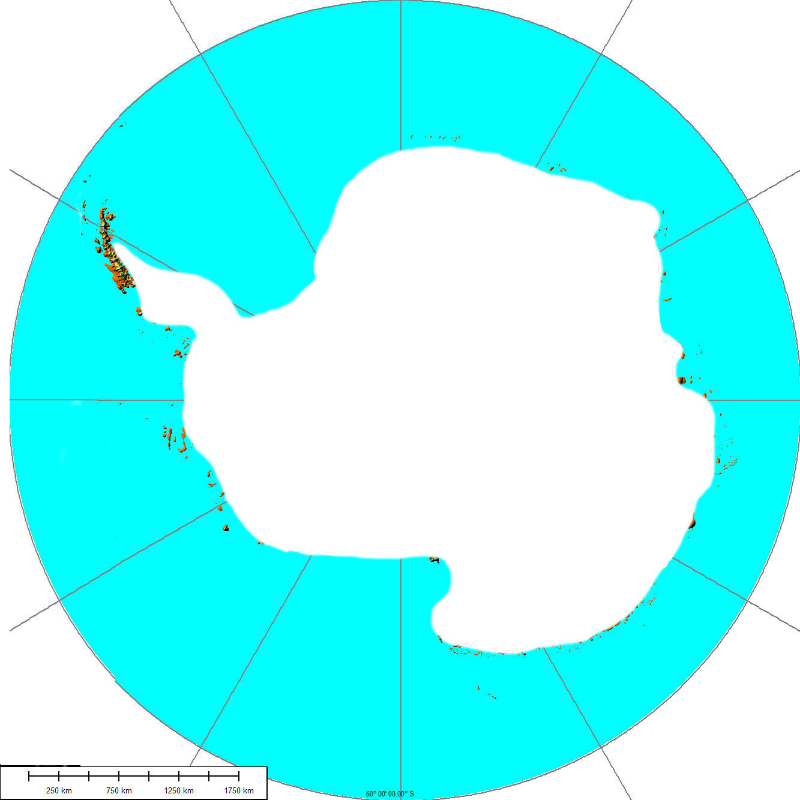
During Antarctic deglaciation the ice likely mostly retreated from the continental shelf to near the coast, with the thickness of the ice close to the coast decreasing to about today’s values (figure 11). Nunataks, mountains that stick above the ice, show glaciation was a few hundred metres higher than today at glacial maximum. The ice was 1,000 m thicker at some locations on the Antarctic Peninsula and Dronning Maud Land of East Antarctic at glacial maximum.25
A later glacial maximum causes the green Sahara
How does this explain the green Sahara? It is known the precipitation for the AHP came from the ITCZ because the oxygen isotope ratios in the water were high.26 The higher the oxygen isotope ratio, the warmer the temperatures, all other variables remaining the same. It is also known that the ITCZ migrates seasonally away from the winter hemisphere and toward the summer hemisphere.27,28 The seasonal range of the ITCZ today is about 12° latitude,29 from 5.3°S to 7.2°N today.30 Therefore, after the Ice Age ends in the Northern Hemisphere in about 700 years, the Ice Age in the Southern Hemisphere would last another 300 years and push the ITCZ farther north toward the warmer Northern Hemisphere than occurs today due to the seasons. Such a condition could push the ITCZ more than 600 km (375 mi) north into the Sahel or even the Sahara Desert and cause the green Sahara.
The timing of the AHP was not half the Holocene, as claimed by uniformitarian scientists, because the 14C dates can be compressed between the Flood, 4,500 years ago,31 and about 3,000 years ago. From 3,000 years ago to the present, the 14C dates measured by uniformitarian scientists would also correspond to the same time in biblical Earth history. Thus, 14C dates from 50,000, the practical limit of the method, and 3,000 years ago can be telescoped to between 4,500 and 3,000 years ago in the biblical timescale. Higher cosmic rays, decreasing exponentially, during the Ice Age may explain why.32
Conclusions
The Sahara Desert was once well watered, hosting numerous aquatic animals and man. Based on thousands of carbon-14 dates, the AHP occurred mostly after the Ice Age, unlike other pluvial periods in now semi-arid and arid locations that occurred during the Ice Age. Uniformitarian scientists are stumped, and their climate simulations are no help. In the Creation/Flood/Ice Age model, the AHP can be explained by maximum glaciation in Antarctica being about 1,000 years after the Flood. So, after the Northern Hemisphere glaciation ended, the continuing Ice Age on Antarctica and the surrounding ocean would likely push the ITCZ significantly farther northward than its average today. The result would be more rain over the Sahara Desert.
References and notes
- Oard, M.J., Frozen in Time: Woolly Mammoths, the Ice Age, and the Biblical Key to Their Secrets, Master Books, Green Forest, AR, pp. 41–44, 2004. Return to text.
- Oard, M.J., Well-watered deserts: how the Flood solves another Ice Age mystery, Creation 42(2):46–49, 2020. Return to text.
- Jewell, P.W., Quantitative identification of erosional lake Bonneville shorelines, Utah, Geomorphology 253:135–145, 2016. Return to text.
- Oard, M.J., Wonders of Creation—the New Weather Book, Master Books, Green Forest, AR, 2015. Return to text.
- Paillou, P., Schuster, M., Tooth, S., Farr, T., Rosenqvist, A., Lopez, S., and Malezieux, J.-M., Mapping of the major paleodrainage system in eastern Libya using orbital imaging radar: the Kufrah River, Earth and Planetary Science Letters 277:327–333, 2009. Return to text.
- Pachur, H.-J. and Kröpelin, S., Wadi Howar: paleoclimatic evidence from an extinct river system in the southeastern Sahara, Science 237:298–300, 1987. Return to text.
- Chorowicz, J. and Fabre, J., organization of drainage networks from space imagery in the Tanezrouft plateau (Western Sahara): implications for recent intracratonic deformations, Geomorphology 21:139–151, 1997. Return to text.
- Hoelzmann, P., Kruse, H.-J., and Rottinger, F., Precipitation estimates for the eastern Saharan palaeomonsoon based on a water balance model of the West Nubian palaeolake basin, Global and Planetary Change 26:105–120, 2000. Return to text.
- Quade, J., Dente, E., Armon, M., Ben Dor, Y., Morin, E., Adam, O., and Enzel, Y., Megalakes in the Sahara? A review, Quaternary Research 90:253–275, 2018. Return to text.
- Kröpelin, S. and Soulié-Märsche, I., Charophyte remains from Wadi Howar as evidence for deep mid-Holocene freshwater lakes in the eastern Sahara of Northwest Sudan, Quaternary Research 36:210–223, 1991. Return to text.
- Charlesworth, J.K., The Quaternary Era, Edward Arnold, London, UK, p. 1113, 1957. Return to text.
- Drake, N.A., Blench, R.M., Armitage, S.J., Bristow, C.S., and White, K.H., Ancient watercourses and biogeography of the Sahara explain the peopling of the desert, PNAS 108(2):458–462, 2011. Return to text.
- Wellard, J., The Great Sahara, E.P. Duggon & Co., New York, pp. 33–34, 1964. Return to text.
- Manning, K. and Timpson, A., The demographic response to Holocene climate change in the Sahara, Quaternary Science Reviews 101:28–35, 2014. Return to text.
- Lécuyer, C., Lézine, A.-M., Fourel, F., Gasse, F., Sylvestre, F., Pailles, C., Grenier, C., Travi, Y., and Barral, A., I-n-Atei paleolake documents past environmental changes in central Sahara at the time of the ‘Green Sahara’: Charchola, carbon isotope and diatom records, Palaeogeography, Palaeoclimatology, Palaeoecology 441:834–844, 2016. Return to text.
- Otto-Bliesner, B.L., Russell, J.M., Clark, P.U., Liu, Z., Overpeck, J.T., Konecky, B., deMenocal, P., Nicholson, S.E., He, F., and Lu, Z., Coherent changes of southeastern equatorial and northern African rainfall during the last deglaciation, Science 346:1223–1227, 2014. Return to text.
- Braconnot, P., Joussaume, S. de Noblet, N., and Ramstein, G., Mid-Holocene and Last Glacial Maximum African monsoon changes as simulated within the Paleoclimate Modelling Intercomparison Project, Global and Planetary Change 26:51–66, 2000. Return to text.
- Notaro, M., Wang, Y., Liu, Z., Gallimore, R., and Levis, S., Combined statistical and dynamical assessment of simulated vegetation–rainfall interactions in North Africa during the mid-Holocene, Global Change Biology 14:347–368, 2008. Return to text.
- Oard, M.J., The Frozen Record: Examining the Ice Core History of the Greenland and Antarctic Ice Sheets, Institute for Creation Research, Dallas, TX, 2005. Return to text.
- Rind, D., Peteet, D., and Kukla, G., Can Milankovitch orbital variations initiate growth of ice sheets in a general circulation model? J. Geophysical Research 94(D10):12851–12871, 1989. Return to text.
- Oard, M.J., The Great Ice Age: Evidence from the Flood for its quick formation and melting, Awesome Science Media, Richfield, WA, 2013. Return to text.
- Smith, G.I. and Street-Perrott, F.A., Pluvial lakes of the western United States; in: Wright, H.E., Jr., and Porter, S.C. (Eds.), Late-Quaternary Environments of the United States, University of Minnesota Press, Minneapolis, MN, pp. 190–212, 1983. Return to text.
- Ibarra, D.E., Egger, A.E., Weaver, K.L., Harris, C.R., and Maher, K., Rise and fall of late Pleistocene pluvial lakes in response to reduced evaporation and precipitation: evidence from Lake Surprise, California, GSA Bulletin 126(11/12):1387–1415, 2014. Return to text.
- Webb, S., Palaeotrophic reconstruction and climate forcing of mega-Lake Eyre in late Quaternary Central Australia: a review, Boreas 39:312–324, 2010. Return to text.
- Canals, M. et al., Uncovering the footprint of former ice streams off Antarctica, EOS 84(11):97, 102–103, 2003. Return to text.
- Hoelzmann, P., Kruse, H.-J., and Rottinger, F., Precipitation estimates for the eastern Saharan palaeomonsoon based on a water balance model of the West Nubian Palaeolake Basin, Global and Planetary Change 26:103–120, 2000. Return to text.
- Markle, B.R., Steig, E.J., Buizert, C., Schoenemann, S.W., Bitz, C.M., Fudge, T.J., Pedro, J.B., Ding, Q., Jones, T.R., White, J.W.C., and Sowers, T., Global atmospheric teleconnections during Dansgaard-Oeschger events, Nature Geoscience 10:36–40, 2017. Return to text.
- Schneider, T., Bischoff, T., and Haug, G.H., Migrations and dynamics of the intertropical convergence zone, Nature 513:45–53, 2014. Return to text.
- Bahr, A., Hoffmann, J., Schönfeld, J., Schmidt, M.W., Nürnberg, D., Batenburg, S.J., and Voigt, S., Low-latitude expressions of high-latitude forcing during Heinrich Stadial 1 and the Younger Dryas in northern South America, Global and Planetary Change 160:1–9, 2018. Return to text.
- Donohoe, A., Marshall, J., Ferreira, D., and McGee, D., The relationship between ITCZ location and cross-equatorial atmospheric heat transport: from the seasonal cycle to the Last Glacial Maximum, J. Climate 26:3597–3618, 2013. Return to text.
- Thomas, B., Two date range options for Noah’s Flood, J. Creation 31(1):120–127, 2017. Return to text.
- Oard, M.J., Much greater cosmic rays during the Ice Age and before, CRSQ (in press). Return to text.

Readers’ comments
Comments are automatically closed 14 days after publication.